UPS 2015 Annual Report Download - page 38
Download and view the complete annual report
Please find page 38 of the 2015 UPS annual report below. You can navigate through the pages in the report by either clicking on the pages listed below, or by using the keyword search tool below to find specific information within the annual report.-
 1
1 -
2
-
3
-
4
-
5
-
6
-
7
-
8
-
9
-
10
-
11
-
12
-
13
-
14
-
15
-
16
-
17
-
18
-
19
-
20
-
21
-
22
-
23
-
24
-
25
-
26
-
27
-
 28
28 -
 29
29 -
 30
30 -
 31
31 -
 32
32 -
 33
33 -
 34
34 -
 35
35 -
 36
36 -
 37
37 -
 38
38 -
 39
39 -
 40
40 -
 41
41 -
 42
42 -
 43
43 -
 44
44 -
 45
45 -
 46
46 -
 47
47 -
 48
48 -
49
-
50
-
51
-
52
-
53
-
54
-
55
-
56
-
57
-
58
-
59
-
60
-
61
-
62
-
63
-
64
-
65
-
66
-
67
-
68
-
69
-
70
-
71
-
72
-
73
-
74
-
75
-
76
-
77
-
78
-
79
-
80
-
81
-
82
-
83
-
84
-
85
-
86
-
87
-
88
-
89
-
90
-
91
-
92
-
93
-
94
-
95
-
96
-
97
-
98
-
99
-
100
-
101
-
102
-
103
-
104
-
105
-
106
-
107
-
108
-
109
-
110
-
111
-
112
-
113
-
114
-
115
-
116
-
117
-
118
-
119
-
120
-
121
-
122
-
123
-
124
-
125
-
126
-
127
-
128
-
129
-
130
-
131
-
132
-
133
-
134
-
135
-
136
-
137
-
138
-
139
-
140
-
141
-
142
-
143
-
144
-
145
-
146
-
147
-
148
 |
 |

UNITED PARCEL SERVICE, INC. AND SUBSIDIARIES
MANAGEMENT'S DISCUSSION AND ANALYSIS OF FINANCIAL CONDITION AND
RESULTS OF OPERATIONS
26
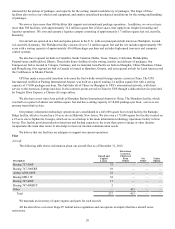
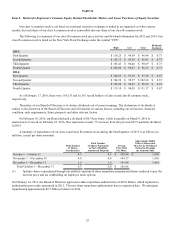
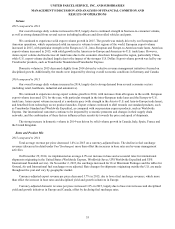
Items Affecting Comparability
The year-over-year comparisons of our financial results are affected by the following items (in millions):
Year Ended December 31,
2015 2014 2013
Operating Expenses:
Defined Benefit Plans Mark-to-Market Charge $ 118 $ 1,062 $ —
Health & Welfare Plan Charges — 1,102 —
TNT Termination Fee and Related Expenses — — 284
Gain Upon Liquidation of Foreign Subsidiary — — (245)
Total Adjustments to Operating Expenses 118 2,164 39
Income Tax Expense (Benefit) from the Items Above (39)(807)(75)
Total Adjustments to Net Income $ 79 $ 1,357 $ (36)
These items have been excluded from comparisons of "adjusted" operating expenses, operating profit, operating margin
and income taxes in the discussion that follows.
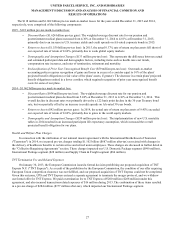
Defined Benefit Plans Mark-to-Market Charge
In 2015, we recognized pre-tax mark-to-market losses in compensation and benefits expense of $118 million ($79 million
after-tax) on our pension and postretirement defined benefit plans related to the remeasurement of plan assets and liabilities
recognized outside of a 10% corridor. These charges impacted our U.S. Domestic Package segment ($62 million), International
Package segment ($44 million) and Supply Chain & Freight segment ($12 million).
In 2014, we recognized pre-tax mark-to-market losses in compensation and benefits expense of $1.062 billion ($670
million after-tax) on our pension and postretirement defined benefit plans related to the remeasurement of plan assets and
liabilities recognized outside of a 10% corridor. These charges impacted our U.S. Domestic Package segment ($660 million),
International Package segment ($200 million) and Supply Chain & Freight segment ($202 million).
No mark-to-market gain or loss was incurred in 2013, as the remeasurement of plan assets and liabilities only resulted in
adjustments within the 10% corridor (and thus only impacted accumulated other comprehensive income).
The table below indicates the amounts associated with each component of the pre-tax mark-to-market loss, as well as the
weighted-average actuarial assumptions used to determine our net periodic benefit costs, for each year:
Year Ended December 31,
Components of mark-to-market gain (loss) (in millions): 2015 2014 2013
Discount rates $ 1,624 $ (954)$ —
Return on assets (1,550)42 —
Demographic and assumption changes (133)(150)—
Reclassification of prior year unrecognized benefit cost (59)— —
Total mark-to-market gain (loss) $ (118)$ (1,062)$ —
Weighted-average actuarial assumptions used to determine net
periodic benefit cost: 2015 2014 2013
Expected rate of return on plan assets 8.66% 8.66% 8.69%
Actual rate of return on plan assets 0.37% 9.45% 8.36%
Discount rate used for net periodic benefit cost 4.36% 5.24% 4.38%
Discount rate at measurement date 4.81% 4.36% 5.24%