UPS 2015 Annual Report Download - page 41
Download and view the complete annual report
Please find page 41 of the 2015 UPS annual report below. You can navigate through the pages in the report by either clicking on the pages listed below, or by using the keyword search tool below to find specific information within the annual report.-
 1
1 -
2
-
3
-
4
-
5
-
6
-
7
-
8
-
9
-
10
-
11
-
12
-
13
-
14
-
15
-
16
-
17
-
18
-
19
-
20
-
21
-
22
-
23
-
24
-
25
-
26
-
27
-
28
-
29
-
30
-
 31
31 -
 32
32 -
 33
33 -
 34
34 -
 35
35 -
 36
36 -
 37
37 -
 38
38 -
 39
39 -
 40
40 -
 41
41 -
 42
42 -
 43
43 -
 44
44 -
 45
45 -
 46
46 -
 47
47 -
 48
48 -
 49
49 -
 50
50 -
 51
51 -
52
-
53
-
54
-
55
-
56
-
57
-
58
-
59
-
60
-
61
-
62
-
63
-
64
-
65
-
66
-
67
-
68
-
69
-
70
-
71
-
72
-
73
-
74
-
75
-
76
-
77
-
78
-
79
-
80
-
81
-
82
-
83
-
84
-
85
-
86
-
87
-
88
-
89
-
90
-
91
-
92
-
93
-
94
-
95
-
96
-
97
-
98
-
99
-
100
-
101
-
102
-
103
-
104
-
105
-
106
-
107
-
108
-
109
-
110
-
111
-
112
-
113
-
114
-
115
-
116
-
117
-
118
-
119
-
120
-
121
-
122
-
123
-
124
-
125
-
126
-
127
-
128
-
129
-
130
-
131
-
132
-
133
-
134
-
135
-
136
-
137
-
138
-
139
-
140
-
141
-
142
-
143
-
144
-
145
-
146
-
147
-
148
 |
 |

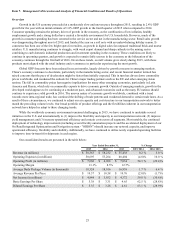
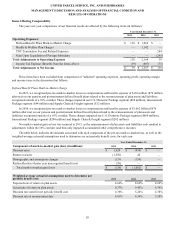
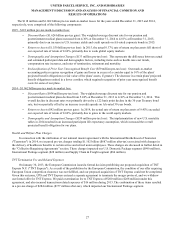
UNITED PARCEL SERVICE, INC. AND SUBSIDIARIES
MANAGEMENT'S DISCUSSION AND ANALYSIS OF FINANCIAL CONDITION AND
RESULTS OF OPERATIONS
29
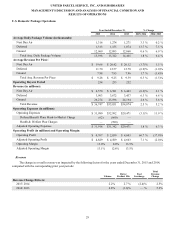
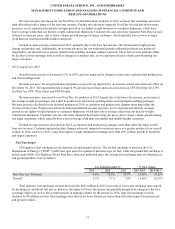
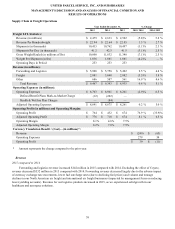
U.S. Domestic Package Operations
Year Ended December 31, % Change
2015 2014 2013 2015/ 2014 2014/ 2013
Average Daily Package Volume (in thousands):
Next Day Air 1,316 1,274 1,271 3.3 % 0.2 %
Deferred 1,313 1,155 1,074 13.7 % 7.5 %
Ground 12,969 12,893 12,060 0.6 % 6.9 %
Total Avg. Daily Package Volume 15,598 15,322 14,405 1.8 % 6.4 %
Average Revenue Per Piece:
Next Day Air $ 19.66 $ 20.42 $ 20.12 (3.7)% 1.5 %
Deferred 11.70 12.57 12.70 (6.9)% (1.0)%
Ground 7.98 7.85 7.96 1.7 % (1.4)%
Total Avg. Revenue Per Piece $ 9.28 $ 9.25 $ 9.39 0.3 % (1.5)%
Operating Days in Period 254 253 252
Revenue (in millions):
Next Day Air $ 6,570 $ 6,581 $ 6,443 (0.2)% 2.1 %
Deferred 3,903 3,672 3,437 6.3 % 6.8 %
Ground 26,274 25,598 24,194 2.6 % 5.8 %
Total Revenue $ 36,747 $35,851 $34,074 2.5 % 5.2 %
Operating Expenses (in millions):
Operating Expenses $ 31,980 $32,992 $29,471 (3.1)% 11.9 %
Defined Benefit Plans Mark-to-Market Charge (62)(660)—
Health & Welfare Plan Charges —(990)—
Adjusted Operating Expenses $ 31,918 $31,342 $29,471 1.8 % 6.3 %
Operating Profit (in millions) and Operating Margin:
Operating Profit $ 4,767 $ 2,859 $ 4,603 66.7 % (37.9)%
Adjusted Operating Profit $ 4,829 $ 4,509 $ 4,603 7.1 % (2.0)%
Operating Margin 13.0% 8.0% 13.5%
Adjusted Operating Margin 13.1% 12.6% 13.5%
Revenue
The change in overall revenue was impacted by the following factors for the years ended December 31, 2015 and 2014,
compared with the corresponding prior year periods:
Volume
Rates /
Product Mix
Fuel
Surcharge
Total
Revenue
Change
Revenue Change Drivers:
2015/ 2014 2.2% 2.7 % (2.4)% 2.5%
2014/ 2013 6.8% (1.6)% — % 5.2%