UPS 2015 Annual Report Download - page 84
Download and view the complete annual report
Please find page 84 of the 2015 UPS annual report below. You can navigate through the pages in the report by either clicking on the pages listed below, or by using the keyword search tool below to find specific information within the annual report.-
 1
1 -
2
-
3
-
4
-
5
-
6
-
7
-
8
-
9
-
10
-
11
-
12
-
13
-
14
-
15
-
16
-
17
-
18
-
19
-
20
-
21
-
22
-
23
-
24
-
25
-
26
-
27
-
28
-
29
-
30
-
31
-
32
-
33
-
34
-
35
-
36
-
37
-
38
-
39
-
40
-
41
-
42
-
43
-
44
-
45
-
46
-
47
-
48
-
49
-
50
-
51
-
52
-
53
-
54
-
55
-
56
-
57
-
58
-
59
-
60
-
61
-
62
-
63
-
64
-
65
-
66
-
67
-
68
-
69
-
70
-
71
-
72
-
73
-
 74
74 -
 75
75 -
 76
76 -
 77
77 -
 78
78 -
 79
79 -
 80
80 -
 81
81 -
 82
82 -
 83
83 -
 84
84 -
 85
85 -
 86
86 -
 87
87 -
 88
88 -
 89
89 -
 90
90 -
 91
91 -
 92
92 -
 93
93 -
 94
94 -
95
-
96
-
97
-
98
-
99
-
100
-
101
-
102
-
103
-
104
-
105
-
106
-
107
-
108
-
109
-
110
-
111
-
112
-
113
-
114
-
115
-
116
-
117
-
118
-
119
-
120
-
121
-
122
-
123
-
124
-
125
-
126
-
127
-
128
-
129
-
130
-
131
-
132
-
133
-
134
-
135
-
136
-
137
-
138
-
139
-
140
-
141
-
142
-
143
-
144
-
145
-
146
-
147
-
148
 |
 |

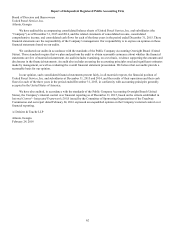
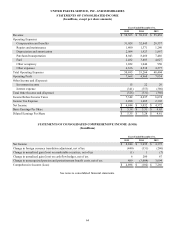
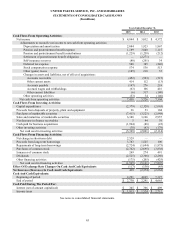
UNITED PARCEL SERVICE, INC. AND SUBSIDIARIES
NOTES TO CONSOLIDATED FINANCIAL STATEMENTS
72
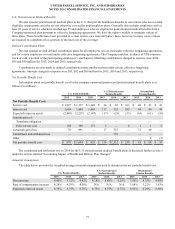
The gross realized gains on sales of available-for-sale securities totaled $1, $1 and $11 million in 2015, 2014, and 2013,
respectively. The gross realized losses on sales of available-for-sale securities totaled $1, $0 and $6 million in 2015, 2014, and
2013, respectively.
There were no material impairment losses recognized on marketable securities during 2015, 2014 or 2013.
Investment Other-Than-Temporary Impairments
We have concluded that no material other-than-temporary impairment losses existed as of December 31, 2015. In making
this determination, we considered the financial condition and prospects of the issuer, the magnitude of the losses compared with
the investments’ cost, the probability that we will be unable to collect all amounts due according to the contractual terms of the
security, the credit rating of the security and our ability and intent to hold these investments until the anticipated recovery in
market value occurs.
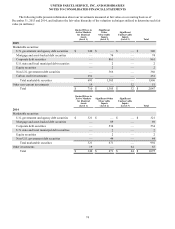
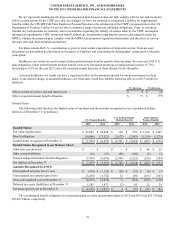
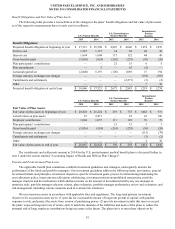
Unrealized Losses
The following table presents the age of gross unrealized losses and fair value by investment category for all securities in a
loss position as of December 31, 2015 (in millions):
Less Than 12 Months 12 Months or More Total
Fair Value
Unrealized
Losses Fair Value
Unrealized
Losses Fair Value
Unrealized
Losses
U.S. government and agency debt securities $ 168 $ (1)$ —$ —$ 168$ (1)
Mortgage and asset-backed debt securities ——28 (1)28 (1)
Corporate debt securities ——50 (1)50 (1)
U.S. state and local municipal debt securities ——————
Equity securities ——————
Non-U.S. government debt securities ——————
Carbon credit investments 189 (5) — — 189 (5)
Other investment securities ——————
Total marketable securities $ 357 $ (6) $ 78 $ (2) $ 435 $ (8)
The unrealized losses for the U.S. government and agency debt securities and mortgage and asset-backed debt securities
are primarily due to changes in market interest rates. We have both the intent and ability to hold the securities contained in the
previous table for a time necessary to recover the cost basis.
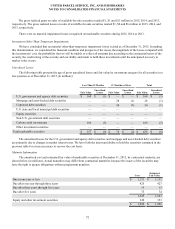
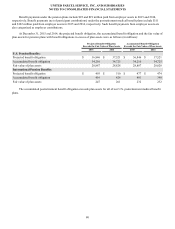
Maturity Information
The amortized cost and estimated fair value of marketable securities at December 31, 2015, by contractual maturity, are
shown below (in millions). Actual maturities may differ from contractual maturities because the issuers of the securities may
have the right to prepay obligations without prepayment penalties.
Cost
Estimated
Fair Value
Due in one year or less $ 1,131 $ 1,131
Due after one year through three years 425 423
Due after three years through five years 14 15
Due after five years 75 74
1,645 1,643
Equity and other investment securities 349 353
$ 1,994 $ 1,996