UPS 2015 Annual Report Download - page 40
Download and view the complete annual report
Please find page 40 of the 2015 UPS annual report below. You can navigate through the pages in the report by either clicking on the pages listed below, or by using the keyword search tool below to find specific information within the annual report.-
 1
1 -
2
-
3
-
4
-
5
-
6
-
7
-
8
-
9
-
10
-
11
-
12
-
13
-
14
-
15
-
16
-
17
-
18
-
19
-
20
-
21
-
22
-
23
-
24
-
25
-
26
-
27
-
28
-
29
-
 30
30 -
 31
31 -
 32
32 -
 33
33 -
 34
34 -
 35
35 -
 36
36 -
 37
37 -
 38
38 -
 39
39 -
 40
40 -
 41
41 -
 42
42 -
 43
43 -
 44
44 -
 45
45 -
 46
46 -
 47
47 -
 48
48 -
 49
49 -
 50
50 -
51
-
52
-
53
-
54
-
55
-
56
-
57
-
58
-
59
-
60
-
61
-
62
-
63
-
64
-
65
-
66
-
67
-
68
-
69
-
70
-
71
-
72
-
73
-
74
-
75
-
76
-
77
-
78
-
79
-
80
-
81
-
82
-
83
-
84
-
85
-
86
-
87
-
88
-
89
-
90
-
91
-
92
-
93
-
94
-
95
-
96
-
97
-
98
-
99
-
100
-
101
-
102
-
103
-
104
-
105
-
106
-
107
-
108
-
109
-
110
-
111
-
112
-
113
-
114
-
115
-
116
-
117
-
118
-
119
-
120
-
121
-
122
-
123
-
124
-
125
-
126
-
127
-
128
-
129
-
130
-
131
-
132
-
133
-
134
-
135
-
136
-
137
-
138
-
139
-
140
-
141
-
142
-
143
-
144
-
145
-
146
-
147
-
148
 |
 |
UNITED PARCEL SERVICE, INC. AND SUBSIDIARIES
MANAGEMENT'S DISCUSSION AND ANALYSIS OF FINANCIAL CONDITION AND
RESULTS OF OPERATIONS
28
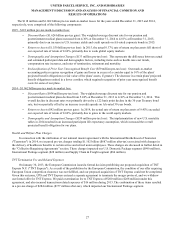
Gain Upon the Liquidation of a Foreign Subsidiary
Subsequent to the termination of the merger protocol, we liquidated a foreign subsidiary that would have been used to
acquire the outstanding shares of TNT Express in connection with the proposed acquisition. Upon the liquidation of this
subsidiary in 2013, we realized a pre-tax foreign currency gain of $245 million ($213 million after-tax), which impacted our
International Package segment.
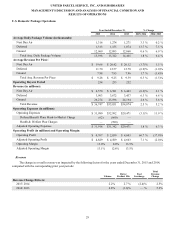
Results of Operations—Segment Review
The results and discussions that follow are reflective of how our executive management monitors the performance of our
reporting segments. We supplement the reporting of our financial information determined under generally accepted accounting
principles (“GAAP”) with certain non-GAAP financial measures, including operating profit, operating margin, pre-tax income,
net income and earnings per share adjusted for the non-comparable items discussed previously. We believe that these adjusted
measures provide meaningful information to assist investors and analysts in understanding our financial results and assessing
our prospects for future performance. We believe these adjusted financial measures are important indicators of our recurring
results of operations because they exclude items that may not be indicative of, or are unrelated to, our core operating results,
and provide a better baseline for analyzing trends in our underlying businesses. Additionally, these adjusted financial measures
are used internally by management for the determination of incentive compensation awards, business unit operating
performance analysis, and business unit resource allocation.
As discussed in our "Critical Accounting Policies and Estimates", we recognize changes in the fair value of plan assets
and net actuarial gains and losses in excess of a 10% corridor for company-sponsored pension and post-retirement liabilities
immediately as part of net periodic benefit cost. In our results of operations and the discussions that follow, we have presented
adjusted operating expenses, adjusted operating profit and adjusted operating margin excluding the portion of net periodic
benefit cost represented by the gains and losses recognized in excess of the 10% corridor. This adjusted net periodic benefit cost
is comparable to the accounting for our defined benefit plans in our quarterly reporting under U.S. GAAP, and reflects
assumptions utilizing the expected return on plan assets and the discount rate used for determining net periodic benefit cost (the
non-adjusted net periodic benefit cost reflects the actual return on plan assets and the discount rate used for measuring the
projected benefit obligation). We believe this adjusted net periodic benefit cost provides important supplemental information
that reflects the anticipated long-term cost of our defined benefit plans, and provides a benchmark for historical defined benefit
cost trends that can be used to better compare year-to-year financial performance without considering the short-term impact of
changes in market interest rates, equity prices, and similar factors.
Certain operating expenses are allocated between our reporting segments based on activity-based costing methods. These
activity-based costing methods require us to make estimates that impact the amount of each expense category that is attributed
to each segment. Changes in these estimates will directly impact the amount of expense allocated to each segment, and
therefore the operating profit of each reporting segment. There were no significant changes in our expense allocation
methodology during 2015, 2014 or 2013.