UPS 2015 Annual Report Download - page 46
Download and view the complete annual report
Please find page 46 of the 2015 UPS annual report below. You can navigate through the pages in the report by either clicking on the pages listed below, or by using the keyword search tool below to find specific information within the annual report.-
 1
1 -
2
-
3
-
4
-
5
-
6
-
7
-
8
-
9
-
10
-
11
-
12
-
13
-
14
-
15
-
16
-
17
-
18
-
19
-
20
-
21
-
22
-
23
-
24
-
25
-
26
-
27
-
28
-
29
-
30
-
31
-
32
-
33
-
34
-
35
-
 36
36 -
 37
37 -
 38
38 -
 39
39 -
 40
40 -
 41
41 -
 42
42 -
 43
43 -
 44
44 -
 45
45 -
 46
46 -
 47
47 -
 48
48 -
 49
49 -
 50
50 -
 51
51 -
 52
52 -
 53
53 -
 54
54 -
 55
55 -
 56
56 -
57
-
58
-
59
-
60
-
61
-
62
-
63
-
64
-
65
-
66
-
67
-
68
-
69
-
70
-
71
-
72
-
73
-
74
-
75
-
76
-
77
-
78
-
79
-
80
-
81
-
82
-
83
-
84
-
85
-
86
-
87
-
88
-
89
-
90
-
91
-
92
-
93
-
94
-
95
-
96
-
97
-
98
-
99
-
100
-
101
-
102
-
103
-
104
-
105
-
106
-
107
-
108
-
109
-
110
-
111
-
112
-
113
-
114
-
115
-
116
-
117
-
118
-
119
-
120
-
121
-
122
-
123
-
124
-
125
-
126
-
127
-
128
-
129
-
130
-
131
-
132
-
133
-
134
-
135
-
136
-
137
-
138
-
139
-
140
-
141
-
142
-
143
-
144
-
145
-
146
-
147
-
148
 |
 |

UNITED PARCEL SERVICE, INC. AND SUBSIDIARIES
MANAGEMENT'S DISCUSSION AND ANALYSIS OF FINANCIAL CONDITION AND
RESULTS OF OPERATIONS
34
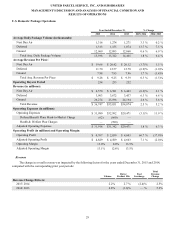
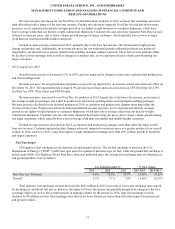
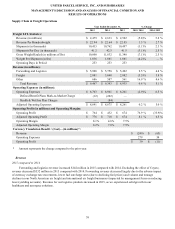
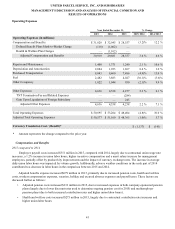
International Package Operations
Year Ended December 31, % Change
2015 2014 2013 2015/ 2014 2014/ 2013
Average Daily Package Volume (in thousands):
Domestic 1,575 1,579 1,499 (0.3)% 5.3 %
Export 1,151 1,115 1,034 3.2 % 7.8 %
Total Avg. Daily Package Volume 2,726 2,694 2,533 1.2 % 6.4 %
Average Revenue Per Piece:
Domestic $ 6.06 $ 6.97 $ 7.06 (13.1)% (1.3)%
Export 31.10 33.98 35.18 (8.5)% (3.4)%
Total Avg. Revenue Per Piece $ 16.63 $ 18.15 $ 18.54 (8.4)% (2.1)%
Operating Days in Period 254 253 252
Revenue (in millions):
Domestic $ 2,425 $ 2,784 $ 2,667 (12.9)% 4.4 %
Export 9,092 9,586 9,166 (5.2)% 4.6 %
Cargo 632 618 596 2.3 % 3.7 %
Total Revenue $12,149 $12,988 $12,429 (6.5)% 4.5 %
Operating Expenses (in millions):
Operating Expenses $10,012 $11,311 $10,672 (11.5)% 6.0 %
Defined Benefit Plan Mark-to-Market Charge (44)(200)—
Health & Welfare Plan Charges —(28)—
Gain Upon Liquidation of Foreign Subsidiary — — 245
TNT Termination Fee and Related Expenses ——
(284)
Adjusted Operating Expenses $ 9,968 $11,083 $10,633 (10.1)% 4.2 %
Operating Profit (in millions) and Operating Margin:
Operating Profit $ 2,137 $ 1,677 $ 1,757 27.4 % (4.6)%
Adjusted Operating Profit $ 2,181 $ 1,905 $ 1,796 14.5 % 6.1 %
Operating Margin 17.6% 12.9% 14.1%
Adjusted Operating Margin 18.0% 14.7% 14.5%
Currency Translation Benefit / (Cost)—(in millions)*:
Revenue $ (880) $ (72)
Operating Expenses 858 87
Operating Profit $ (22) $ 15
* Net of currency hedging; amount represents the change compared to the prior year.
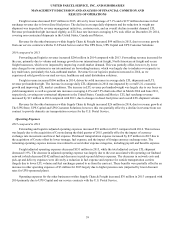
Revenue
The change in overall revenue was impacted by the following factors for the years ended December 31, 2015 and 2014,
compared with the corresponding prior year periods:
Volume
Rates /
Product Mix
Fuel
Surcharge Currency
Total
Revenue
Change
Revenue Change Drivers:
2015/ 2014 1.6% 1.9 % (3.2)% (6.8)% (6.5)%
2014/ 2013 6.8% (1.7)% — % (0.6)% 4.5 %