UPS 2015 Annual Report Download - page 118
Download and view the complete annual report
Please find page 118 of the 2015 UPS annual report below. You can navigate through the pages in the report by either clicking on the pages listed below, or by using the keyword search tool below to find specific information within the annual report.-
 1
1 -
2
-
3
-
4
-
5
-
6
-
7
-
8
-
9
-
10
-
11
-
12
-
13
-
14
-
15
-
16
-
17
-
18
-
19
-
20
-
21
-
22
-
23
-
24
-
25
-
26
-
27
-
28
-
29
-
30
-
31
-
32
-
33
-
34
-
35
-
36
-
37
-
38
-
39
-
40
-
41
-
42
-
43
-
44
-
45
-
46
-
47
-
48
-
49
-
50
-
51
-
52
-
53
-
54
-
55
-
56
-
57
-
58
-
59
-
60
-
61
-
62
-
63
-
64
-
65
-
66
-
67
-
68
-
69
-
70
-
71
-
72
-
73
-
74
-
75
-
76
-
77
-
78
-
79
-
80
-
81
-
82
-
83
-
84
-
85
-
86
-
87
-
88
-
89
-
90
-
91
-
92
-
93
-
94
-
95
-
96
-
97
-
98
-
99
-
100
-
101
-
102
-
103
-
104
-
105
-
106
-
107
-
 108
108 -
 109
109 -
 110
110 -
 111
111 -
 112
112 -
 113
113 -
 114
114 -
 115
115 -
 116
116 -
 117
117 -
 118
118 -
 119
119 -
 120
120 -
 121
121 -
 122
122 -
 123
123 -
 124
124 -
 125
125 -
 126
126 -
 127
127 -
 128
128 -
129
-
130
-
131
-
132
-
133
-
134
-
135
-
136
-
137
-
138
-
139
-
140
-
141
-
142
-
143
-
144
-
145
-
146
-
147
-
148
 |
 |

UNITED PARCEL SERVICE, INC. AND SUBSIDIARIES
NOTES TO CONSOLIDATED FINANCIAL STATEMENTS
106
Shares
(in thousands)
Weighted Average
Grant Date
Fair Value
Weighted Average Remaining
Contractual Term
(in years)
Aggregate Intrinsic
Value (in millions)
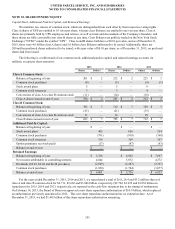
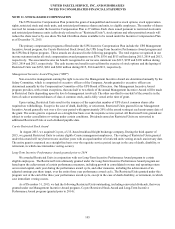
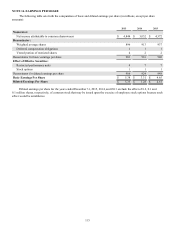
Nonvested at January 1, 2015 11,559 $ 82.58
Vested (5,867) 80.27
Granted 5,118 100.63
Reinvested Dividends 359 N/A
Forfeited / Expired (157) 90.23
Nonvested at December 31, 2015 11,012 $ 90.71 1.37 $ 1,060
Restricted Units Expected to Vest 10,783 $ 90.77 1.36 $ 1,038
The fair value of each Restricted Unit is the NYSE closing price of class B common stock on the date of grant. The
weighted-average grant date fair value of Restricted Units granted during 2015, 2014 and 2013 was $100.63, $92.35 and
$80.18, respectively. The total fair value of Restricted Units vested was $564, $579 and $510 million in 2015, 2014 and 2013,
respectively. As of December 31, 2015, there was $488 million of total unrecognized compensation cost related to nonvested
Restricted Units. That cost is expected to be recognized over a weighted average period of three years and one month.
Long-Term Incentive Performance Award granted after 2013
Beginning with the Long-Term Incentive Performance grant in 2014, the performance targets are equally-weighted
among consolidated operating return on invested capital, growth in consolidated revenue, and total shareowner return relative to
a peer group of companies. The Restricted Units granted under this award generally vest at the end of a three-year period
(except in the case of death disability, or retirement, in which case immediate vesting occurs on a prorated basis). The number
of Restricted Units earned will be based on the percentage achievement of the performance targets set forth on the grant date.
The range of percentage achievement can vary from 0% to 200% of the target award.
For the two-thirds of the award related to consolidated operating return on invested capital and growth in consolidated
revenue, we recognize the grant-date fair value of these units (less estimated forfeitures) as compensation expense ratably over
the vesting period, based on the number of awards expected to be earned. The remaining one-third of the award related to total
shareowner return relative to a peer group is valued using a Monte Carlo model. This portion of the award was valued at a share
payout of 65.86% and 109.84% of the target grant in 2015 and 2014, respectively, and is recognized as compensation expense
(less estimated forfeitures) ratably over the vesting period.
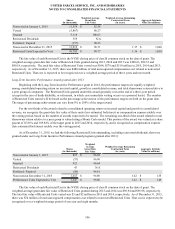
As of December 31, 2015, we had the following Restricted Units outstanding, including reinvested dividends, that were
granted under our Long-Term Incentive Performance Award program (granted after 2013):
Shares
(in thousands)
Weighted
Average
Grant Date
Fair Value
Weighted Average Remaining
Contractual Term
(in years)
Aggregate Intrinsic
Value (in millions)
Nonvested at January 1, 2015 815 $ 96.98
Vested (57) 96.90
Granted 912 96.64
Reinvested Dividends 43 N/A
Forfeited / Expired (98) 96.81
Nonvested at December 31, 2015 1,615 $ 96.80 1.62 $ 155
Performance Units Expected to Vest 1,547 $ 96.80 1.62 $ 149
The fair value of each Restricted Unit is the NYSE closing price of class B common stock on the date of grant. The
weighted-average grant date fair value of Restricted Units granted during 2015 and 2014 was $96.94 and $96.98, respectively.
The total fair value of Restricted Units vested was $5 and $2 million in 2015 and 2014, respectively. As of December 31, 2015,
there was $74 million of total unrecognized compensation cost related to nonvested Restricted Units. That cost is expected to be
recognized over a weighted average period of one year and eight months.