UPS 2015 Annual Report Download - page 4
Download and view the complete annual report
Please find page 4 of the 2015 UPS annual report below. You can navigate through the pages in the report by either clicking on the pages listed below, or by using the keyword search tool below to find specific information within the annual report.-
 1
1 -
 2
2 -
 3
3 -
 4
4 -
 5
5 -
 6
6 -
 7
7 -
 8
8 -
 9
9 -
 10
10 -
 11
11 -
 12
12 -
 13
13 -
 14
14 -
 15
15 -
16
-
17
-
18
-
19
-
20
-
21
-
22
-
23
-
24
-
25
-
26
-
27
-
28
-
29
-
30
-
31
-
32
-
33
-
34
-
35
-
36
-
37
-
38
-
39
-
40
-
41
-
42
-
43
-
44
-
45
-
46
-
47
-
48
-
49
-
50
-
51
-
52
-
53
-
54
-
55
-
56
-
57
-
58
-
59
-
60
-
61
-
62
-
63
-
64
-
65
-
66
-
67
-
68
-
69
-
70
-
71
-
72
-
73
-
74
-
75
-
76
-
77
-
78
-
79
-
80
-
81
-
82
-
83
-
84
-
85
-
86
-
87
-
88
-
89
-
90
-
91
-
92
-
93
-
94
-
95
-
96
-
97
-
98
-
99
-
100
-
101
-
102
-
103
-
104
-
105
-
106
-
107
-
108
-
109
-
110
-
111
-
112
-
113
-
114
-
115
-
116
-
117
-
118
-
119
-
120
-
121
-
122
-
123
-
124
-
125
-
126
-
127
-
128
-
129
-
130
-
131
-
132
-
133
-
134
-
135
-
136
-
137
-
138
-
139
-
140
-
141
-
142
-
143
-
144
-
145
-
146
-
147
-
148
 |
 |

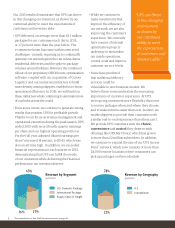
Our2015resultsdemonstratethatUPScanthrive
in this changing environment, as shown by our
continued ability to meet the expectations of
customers and investors alike:
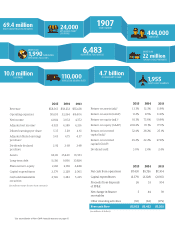
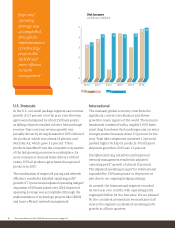
• UPS delivered, on average, more than 18.3 million
packages for our customers each day in 2015,
or 1.7 percent more than the year before. The
e-commerce boom has come with its own set of
challenges – namely, requiring us to continually
optimizeournetworkgiventheriseinless-dense
residential deliveries and the spike in package
volumesaroundholidays.However,thecontinued
rolloutofourproprietaryORIONroute-optimization
software, coupled with our acquisition of Coyote
Logistics and our numerous initiatives to build
more density among shippers, enabled us to boost
operational efficiency. In 2016, we will build on
these initiatives while continuing to automate more
of our hubs across the world.
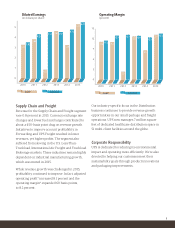
• Even as we invest, we continue to generate strong
results that position UPS for profitable growth.
Thanks to our focus on revenue management and
operational execution during the peak season, UPS
ended 2015 with record fourth-quarter earnings
per share and our highest operating profit ever.
For the full year, adjusted diluted earnings per
share* increased 14 percent, to $5.43, which was
alsoanall-timehigh.Inaddition,weexceeded
financial expectations in each quarter in 2015,
demonstrating that UPS can fulfill the needs
of our customers while delivering the financial
performance our investors deserve.
• While we continue to
make investments that
improvetheefficiencyof
ournetwork,wearealso
improving the customer’s
experience. We currently
have a series of internal
optimization projects
underway to streamline
our inside operations,
controlcostsandimprove
customer service levels.
•Somehavepredicted
that traditional delivery
services could be
vulnerable to new business models. We
believe these views understate the increasing
importance of customer experience. At UPS,
we’regivingconsumersmoreflexibilitythanever
toreceivepackageswhenandwheretheychoose,
andtomakereturnseasierthanever.Inshort,we
enable shippers to provide their customers with
a stellar end-to-end experience that others can’t.
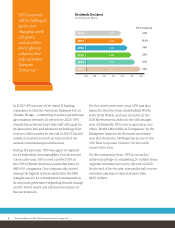
WeprovideUPScustomerswith thechoice,
convenience and control they deserve with
offerings like UPS My Choice,
® which has grown
to more than 22 million subscribers. In addition,
wecontinuetoexpandthesizeofourUPS Access
Point™ network, which now consists of more than
24,000 remote locations where consumers can
pick up packages on their schedule.
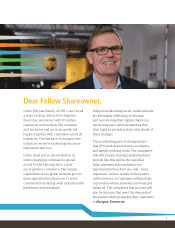
“UPS can thrive
in this changing
environment,
as shown by
our continued
ability to meet
the expectations
of customers and
investors alike.”
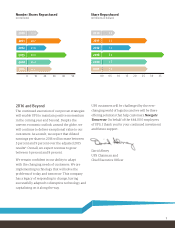
63
%
21%
16%
U.S. Domestic Package
International Package
Supply Chain & Freight
Revenue by Segment
(percent)
Revenue by Geography
(percent)
7
8%
22%
U.S.
International
2*See reconciliation of Non-GAAP financial measures on page A1.
160104_L01_NARR.indd 2 3/3/16 9:25 AM