UPS 2015 Annual Report Download - page 44
Download and view the complete annual report
Please find page 44 of the 2015 UPS annual report below. You can navigate through the pages in the report by either clicking on the pages listed below, or by using the keyword search tool below to find specific information within the annual report.-
 1
1 -
2
-
3
-
4
-
5
-
6
-
7
-
8
-
9
-
10
-
11
-
12
-
13
-
14
-
15
-
16
-
17
-
18
-
19
-
20
-
21
-
22
-
23
-
24
-
25
-
26
-
27
-
28
-
29
-
30
-
31
-
32
-
33
-
 34
34 -
 35
35 -
 36
36 -
 37
37 -
 38
38 -
 39
39 -
 40
40 -
 41
41 -
 42
42 -
 43
43 -
 44
44 -
 45
45 -
 46
46 -
 47
47 -
 48
48 -
 49
49 -
 50
50 -
 51
51 -
 52
52 -
 53
53 -
 54
54 -
55
-
56
-
57
-
58
-
59
-
60
-
61
-
62
-
63
-
64
-
65
-
66
-
67
-
68
-
69
-
70
-
71
-
72
-
73
-
74
-
75
-
76
-
77
-
78
-
79
-
80
-
81
-
82
-
83
-
84
-
85
-
86
-
87
-
88
-
89
-
90
-
91
-
92
-
93
-
94
-
95
-
96
-
97
-
98
-
99
-
100
-
101
-
102
-
103
-
104
-
105
-
106
-
107
-
108
-
109
-
110
-
111
-
112
-
113
-
114
-
115
-
116
-
117
-
118
-
119
-
120
-
121
-
122
-
123
-
124
-
125
-
126
-
127
-
128
-
129
-
130
-
131
-
132
-
133
-
134
-
135
-
136
-
137
-
138
-
139
-
140
-
141
-
142
-
143
-
144
-
145
-
146
-
147
-
148
 |
 |
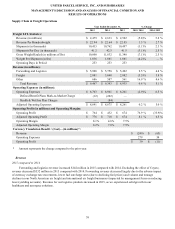
UNITED PARCEL SERVICE, INC. AND SUBSIDIARIES
MANAGEMENT'S DISCUSSION AND ANALYSIS OF FINANCIAL CONDITION AND
RESULTS OF OPERATIONS
32
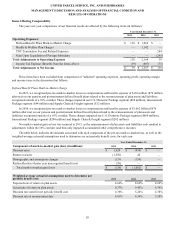
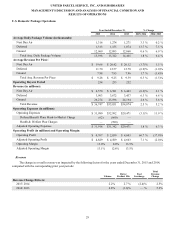
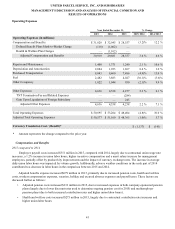
Operating Expenses
2015 compared to 2014
Adjusted operating expenses for the segment increased $576 million in 2015, primarily due to pick-up and delivery costs
(up $602 million), the costs of package sorting (up $172 million) and indirect operating costs (up $122 million). The cost
increases were partially offset by a reduction in the cost of operating our domestic integrated air and ground transportation
network (down $319 million). These costs were impacted by several factors:
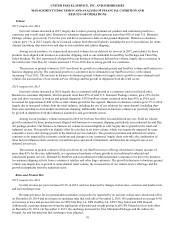
• We incurred higher employee compensation, largely resulting from an increase in average daily union labor hours (up
0.8%), union contractual wage rate increases and growth in the overall size of the workforce.
• Employee benefit costs increased, largely due to increased employee healthcare, pension expense and workers
compensation expense.
• We incurred lower fuel expense in 2015 primarily due to lower fuel prices. This was partially offset by higher fuel
usage (due to an increase in aircraft block hours and vehicle miles driven offset by an increase in average miles per
gallon).
• We incurred lower expenses associated with purchased transportation, primarily due to the decreased use of, and lower
fuel surcharge rates passed to us from rail carriers and outside contract carriers.
• These cost increases were also mitigated by certain network efficiency and productivity improvements, which resulted
in a 0.4% reduction in the total adjusted cost per piece in 2015 compared with 2014. Productivity improvements have
continued to be realized through adjusting our air and ground networks to better match volume levels and utilizing
technology to increase package sorting and delivery efficiency. The continued deployment of ORION has contained
the average daily vehicle miles driven (down 0.4%) even as package volume increased (up 1.8%).
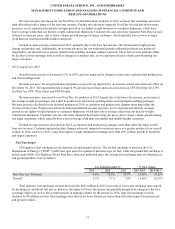
2014 compared to 2013
Adjusted operating expenses for the segment increased $1.871 billion in 2014, primarily due to pick-up and delivery
costs (up $821 million), the cost of operating our domestic integrated air and ground network (up $719 million) and the costs of
package sorting (up $167 million). These costs were impacted by several factors:
• We incurred higher employee compensation costs, largely resulting from an increase in average daily union labor
hours (up 7.5%), union contractual wage rate increases, increased employee healthcare expenses and growth in the
overall size of the workforce. The increase in labor hours was driven by volume growth, additional overtime and
training hours during our fourth quarter holiday shipping season, and adverse weather conditions in early 2014.
• We incurred higher expenses associated with outside contract carriers, due to volume growth, issues associated with
the service performance of rail carriers, and the adverse weather conditions in early 2014.
• These cost increases were partially offset by a reduction in worker's compensation expense, due to actuarial
adjustments that were largely attributable to operational safety and claims management initiatives.
• These cost increases were also mitigated by certain network efficiency and productivity improvements, which resulted
in a 0.4% reduction in the total adjusted cost per piece in 2014 compared with 2013. We have continued to adjust our
air and ground networks to better match higher volume levels, utilize technology to increase package sorting and
delivery efficiency, and benefit from improved pick-up densities. These improvements allowed us to process increased
volume (up 6.4%) at a faster rate than the increase in average daily aircraft block hours (up 2.4%) and vehicle miles
driven (up 4.2%).
Operating Profit and Margin
2015 compared to 2014
Adjusted operating profit increased $320 million in 2015 compared with 2014, while the adjusted operating margin
increased 50 basis points to 13.1%. Overall volume growth allowed us to better leverage our transportation network, leading to
improved productivity (resulting in a lower cost per piece) discussed previously. This was slightly offset by higher pension and
healthcare costs, contractual union wage increases and the negative impact of fuel (fuel surcharge revenue decreased at a faster
rate than fuel expense).