UPS 2015 Annual Report Download - page 48
Download and view the complete annual report
Please find page 48 of the 2015 UPS annual report below. You can navigate through the pages in the report by either clicking on the pages listed below, or by using the keyword search tool below to find specific information within the annual report.-
 1
1 -
2
-
3
-
4
-
5
-
6
-
7
-
8
-
9
-
10
-
11
-
12
-
13
-
14
-
15
-
16
-
17
-
18
-
19
-
20
-
21
-
22
-
23
-
24
-
25
-
26
-
27
-
28
-
29
-
30
-
31
-
32
-
33
-
34
-
35
-
36
-
37
-
 38
38 -
 39
39 -
 40
40 -
 41
41 -
 42
42 -
 43
43 -
 44
44 -
 45
45 -
 46
46 -
 47
47 -
 48
48 -
 49
49 -
 50
50 -
 51
51 -
 52
52 -
 53
53 -
 54
54 -
 55
55 -
 56
56 -
 57
57 -
 58
58 -
59
-
60
-
61
-
62
-
63
-
64
-
65
-
66
-
67
-
68
-
69
-
70
-
71
-
72
-
73
-
74
-
75
-
76
-
77
-
78
-
79
-
80
-
81
-
82
-
83
-
84
-
85
-
86
-
87
-
88
-
89
-
90
-
91
-
92
-
93
-
94
-
95
-
96
-
97
-
98
-
99
-
100
-
101
-
102
-
103
-
104
-
105
-
106
-
107
-
108
-
109
-
110
-
111
-
112
-
113
-
114
-
115
-
116
-
117
-
118
-
119
-
120
-
121
-
122
-
123
-
124
-
125
-
126
-
127
-
128
-
129
-
130
-
131
-
132
-
133
-
134
-
135
-
136
-
137
-
138
-
139
-
140
-
141
-
142
-
143
-
144
-
145
-
146
-
147
-
148
 |
 |
UNITED PARCEL SERVICE, INC. AND SUBSIDIARIES
MANAGEMENT'S DISCUSSION AND ANALYSIS OF FINANCIAL CONDITION AND
RESULTS OF OPERATIONS
36
2014 compared to 2013
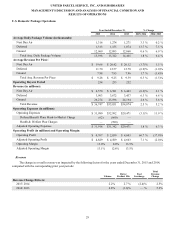
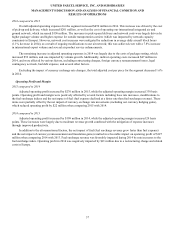
Total average revenue per piece decreased 1.5% in 2014 on a currency-adjusted basis, and was impacted by changes in
base rates as well as product mix.
On December 30, 2013, we implemented an average 4.9% net increase in base and accessorial rates for international
shipments originating in the United States (Worldwide Express, Worldwide Saver, UPS Worldwide Expedited and UPS
International Standard service). Rate changes for shipments originating outside the U.S. are made throughout the year and vary
by geographic market.
Currency-adjusted export revenue per piece decreased 3.1% in 2014, as the shift in product mix from our premium
express products to our standard products more than offset the increase in base rates (volume for our standard products
increased 12%, while volume for our premium express products increased 4%). Additionally, currency-adjusted export revenue
per piece was adversely impacted by shorter average trade lanes (due to faster growth in intra-regional shipments) and changes
in customer mix (as export volume growth for larger customers exceeded the volume growth for higher-yielding middle market
customers).
Currency-adjusted domestic revenue per piece increased 0.3% in 2014, and was impacted by base rate increases, as well
as changes in product mix and fuel surcharge rates.
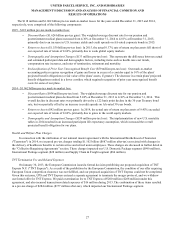
Fuel Surcharges
We maintain fuel surcharges on our international air and ground services. The fuel surcharges for international air
products originating inside or outside the United States are indexed to the DOE's Gulf Coast spot price for a gallon of kerosene-
type jet fuel, while the fuel surcharges for ground products originating outside the United States are indexed to fuel prices in the
international region or country where the shipment takes place.
Total international fuel surcharge revenue decreased by $516 million in 2015, primarily due to lower fuel prices; however,
this was partially offset by an increase in overall volume and pricing changes made to the fuel surcharge indices. Total
international fuel surcharge revenue increased by $2 million in 2014, as the combined impact of international air volume
growth and modifications to the fuel surcharge indices were largely offset by declining fuel prices.
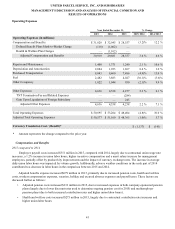
Operating Expenses
2015 compared to 2014
Overall adjusted operating expenses for the segment decreased $1.115 billion in 2015. This decrease was mostly due to
currency exchange rate movements and lower fuel expense.
The decrease in operating expenses was impacted by the cost of operating our international integrated air and ground
network, which decreased $617 million, as well as pick-up and delivery costs, which decreased $332 million. The decreases in
network and pick-up and delivery costs were largely due to the impact of currency exchange rate movements, lower fuel
expense, and a reduction in expense for outside transportation carriers (due to lower fuel surcharges passed to us from the
carriers). Additionally, network costs were mitigated by restraining the growth in aircraft block hours (down 1.1% in 2015), as a
result of ongoing modifications to our air network; this was achieved with a 3.2% increase in international export volume and
continuing air product service enhancements.
The remaining decrease in operating expenses in 2015 was largely due to reductions of indirect operating costs and the
cost of package sorting. Indirect operating costs decreased $130 million and the cost of package sorting decreased by $36
million. Both of these decreases were mainly attributable to the impact of currency.
Excluding the impact of currency exchange rate changes, the total adjusted cost per piece for the segment decreased 4.0%
in 2015.