UPS 2015 Annual Report Download - page 7
Download and view the complete annual report
Please find page 7 of the 2015 UPS annual report below. You can navigate through the pages in the report by either clicking on the pages listed below, or by using the keyword search tool below to find specific information within the annual report.-
 1
1 -
 2
2 -
 3
3 -
 4
4 -
 5
5 -
 6
6 -
 7
7 -
 8
8 -
 9
9 -
 10
10 -
 11
11 -
 12
12 -
 13
13 -
 14
14 -
 15
15 -
 16
16 -
 17
17 -
 18
18 -
19
-
20
-
21
-
22
-
23
-
24
-
25
-
26
-
27
-
28
-
29
-
30
-
31
-
32
-
33
-
34
-
35
-
36
-
37
-
38
-
39
-
40
-
41
-
42
-
43
-
44
-
45
-
46
-
47
-
48
-
49
-
50
-
51
-
52
-
53
-
54
-
55
-
56
-
57
-
58
-
59
-
60
-
61
-
62
-
63
-
64
-
65
-
66
-
67
-
68
-
69
-
70
-
71
-
72
-
73
-
74
-
75
-
76
-
77
-
78
-
79
-
80
-
81
-
82
-
83
-
84
-
85
-
86
-
87
-
88
-
89
-
90
-
91
-
92
-
93
-
94
-
95
-
96
-
97
-
98
-
99
-
100
-
101
-
102
-
103
-
104
-
105
-
106
-
107
-
108
-
109
-
110
-
111
-
112
-
113
-
114
-
115
-
116
-
117
-
118
-
119
-
120
-
121
-
122
-
123
-
124
-
125
-
126
-
127
-
128
-
129
-
130
-
131
-
132
-
133
-
134
-
135
-
136
-
137
-
138
-
139
-
140
-
141
-
142
-
143
-
144
-
145
-
146
-
147
-
148
 |
 |

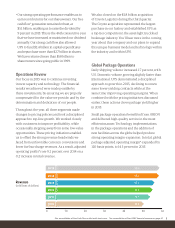
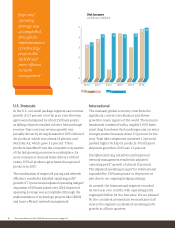
Supply Chain and Freight
Revenue for the Supply Chain and Freight segment
rose 0.8 percent in 2015. Currency exchange rate
changes and lower fuel surcharges contributed to
abouta450-basispointdrag onrevenuegrowth.
Initiatives to improve account profitability in
Forwarding and UPS Freight resulted in lower
revenues, yet higher profits. The segment also
suffered from slowing in the U.S. Less-Than-
Truckload, International Air Freight and Truckload
Brokerage markets. These industries remain highly
dependent on industrial manufacturing growth,
which was muted in 2015.
While revenue growth was challenged in 2015,
profitability continued to improve. In fact, adjusted
operating profit* increased 8.1 percent and the
operating margin* expanded 60 basis points,
to 8.2 percent.
Our industry-specific focus in the Distribution
business continues to provide revenue growth
opportunities in our small-package and freight
operations. UPS now manages 7 million square
feet of dedicated healthcare distribution space in
51 multi-client facilities around the globe.
Corporate Responsibility
UPS is dedicated to reducing its environmental
impact and operating more efficiently. We’re also
devoted to helping our customers meet their
sustainability goals through product innovations
and packaging improvements.
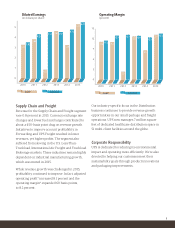
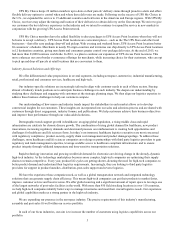
Diluted Earnings
(in dollars per share)
0
1
2
3
4
5
20152010 2011 2012 2013 2014
GAAP Adjusted*
3.33
3.84
4.35
0.83
4.53 4.61 4.75
3.28
5.43
5.35
4.57
3.48
0
3
6
9
12
15
20152010 2011 2012 2013 2014
GAAP Adjusted*
11.4 11.4
12.9
2.5
13.1 12.7 12.2
8.5
13.3
13.1
12.8
11.5
Operating Margin
(percent)
5
160104_L01_NARR.indd 5 3/2/16 5:56 PM