UPS 2015 Annual Report Download - page 83
Download and view the complete annual report
Please find page 83 of the 2015 UPS annual report below. You can navigate through the pages in the report by either clicking on the pages listed below, or by using the keyword search tool below to find specific information within the annual report.-
 1
1 -
2
-
3
-
4
-
5
-
6
-
7
-
8
-
9
-
10
-
11
-
12
-
13
-
14
-
15
-
16
-
17
-
18
-
19
-
20
-
21
-
22
-
23
-
24
-
25
-
26
-
27
-
28
-
29
-
30
-
31
-
32
-
33
-
34
-
35
-
36
-
37
-
38
-
39
-
40
-
41
-
42
-
43
-
44
-
45
-
46
-
47
-
48
-
49
-
50
-
51
-
52
-
53
-
54
-
55
-
56
-
57
-
58
-
59
-
60
-
61
-
62
-
63
-
64
-
65
-
66
-
67
-
68
-
69
-
70
-
71
-
72
-
 73
73 -
 74
74 -
 75
75 -
 76
76 -
 77
77 -
 78
78 -
 79
79 -
 80
80 -
 81
81 -
 82
82 -
 83
83 -
 84
84 -
 85
85 -
 86
86 -
 87
87 -
 88
88 -
 89
89 -
 90
90 -
 91
91 -
 92
92 -
 93
93 -
94
-
95
-
96
-
97
-
98
-
99
-
100
-
101
-
102
-
103
-
104
-
105
-
106
-
107
-
108
-
109
-
110
-
111
-
112
-
113
-
114
-
115
-
116
-
117
-
118
-
119
-
120
-
121
-
122
-
123
-
124
-
125
-
126
-
127
-
128
-
129
-
130
-
131
-
132
-
133
-
134
-
135
-
136
-
137
-
138
-
139
-
140
-
141
-
142
-
143
-
144
-
145
-
146
-
147
-
148
 |
 |

UNITED PARCEL SERVICE, INC. AND SUBSIDIARIES
NOTES TO CONSOLIDATED FINANCIAL STATEMENTS
71
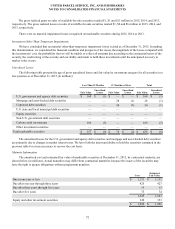
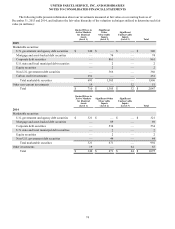
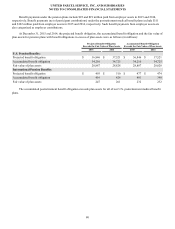
NOTE 2. CASH AND INVESTMENTS
The following is a summary of marketable securities classified as trading and available-for-sale at December 31, 2015
and 2014 (in millions):
Cost
Unrealized
Gains
Unrealized
Losses
Estimated
Fair Value
2015
Current trading marketable securities:
Corporate debt securities $ 715 $ — $ — $ 715
Non-U.S. government debt securities 363 — — 363
Carbon credit investments 347 9 (5) 351
Total trading marketable securities 1,425 9 (5) 1,429
Current available-for-sale marketable securities:
U.S. government and agency debt securities $ 341 $ — $ (1) $ 340
Mortgage and asset-backed debt securities 74 1 (1)74
Corporate debt securities 147 — (1) 146
U.S. state and local municipal debt securities 2 — — 2
Equity securities 2 — — 2
Non-U.S. government debt securities 3 — — 3
Total available-for-sale marketable securities 569 1 (3) 567
Total current marketable securities $ 1,994 $ 10 $ (8) $ 1,996
Cost
Unrealized
Gains
Unrealized
Losses
Estimated
Fair Value
2014
Current trading marketable securities:
Corporate debt securities $ 388 $ — $ — $ 388
Non-U.S. government debt securities 42 — — 42
Carbon credit investments — — — —
Total trading marketable securities 430 — — 430
Current available-for-sale marketable securities:
U.S. government and agency debt securities $ 321 $ 1 $ (1) $ 321
Mortgage and asset-backed debt securities 89 1 (1)89
Corporate debt securities 146 — — 146
U.S. state and local municipal debt securities 2 — — 2
Equity securities 3 — — 3
Non-U.S. government debt securities 1 — — 1
Total available-for-sale marketable securities 562 2 (2) 562
Total current marketable securities $ 992 $ 2 $ (2) $ 992