UPS 2015 Annual Report Download - page 57
Download and view the complete annual report
Please find page 57 of the 2015 UPS annual report below. You can navigate through the pages in the report by either clicking on the pages listed below, or by using the keyword search tool below to find specific information within the annual report.-
 1
1 -
2
-
3
-
4
-
5
-
6
-
7
-
8
-
9
-
10
-
11
-
12
-
13
-
14
-
15
-
16
-
17
-
18
-
19
-
20
-
21
-
22
-
23
-
24
-
25
-
26
-
27
-
28
-
29
-
30
-
31
-
32
-
33
-
34
-
35
-
36
-
37
-
38
-
39
-
40
-
41
-
42
-
43
-
44
-
45
-
46
-
 47
47 -
 48
48 -
 49
49 -
 50
50 -
 51
51 -
 52
52 -
 53
53 -
 54
54 -
 55
55 -
 56
56 -
 57
57 -
 58
58 -
 59
59 -
 60
60 -
 61
61 -
 62
62 -
 63
63 -
 64
64 -
 65
65 -
 66
66 -
 67
67 -
68
-
69
-
70
-
71
-
72
-
73
-
74
-
75
-
76
-
77
-
78
-
79
-
80
-
81
-
82
-
83
-
84
-
85
-
86
-
87
-
88
-
89
-
90
-
91
-
92
-
93
-
94
-
95
-
96
-
97
-
98
-
99
-
100
-
101
-
102
-
103
-
104
-
105
-
106
-
107
-
108
-
109
-
110
-
111
-
112
-
113
-
114
-
115
-
116
-
117
-
118
-
119
-
120
-
121
-
122
-
123
-
124
-
125
-
126
-
127
-
128
-
129
-
130
-
131
-
132
-
133
-
134
-
135
-
136
-
137
-
138
-
139
-
140
-
141
-
142
-
143
-
144
-
145
-
146
-
147
-
148
 |
 |

UNITED PARCEL SERVICE, INC. AND SUBSIDIARIES
MANAGEMENT'S DISCUSSION AND ANALYSIS OF FINANCIAL CONDITION AND
RESULTS OF OPERATIONS
45
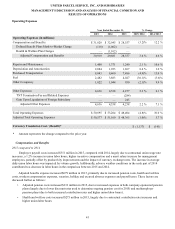
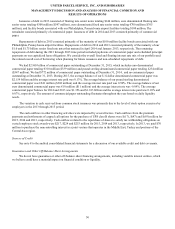
Investment Income and Interest Expense
The following table sets forth investment income and interest expense for the years ended December 31, 2015, 2014 and
2013 (in millions):
Year Ended December 31, % Change
2015 2014 2013 2015/ 2014 2014/ 2013
Investment Income $ 15 $ 22 $ 20 (31.8)% 10.0 %
Interest Expense $ (341)$ (353)$ (380) (3.4)% (7.1)%
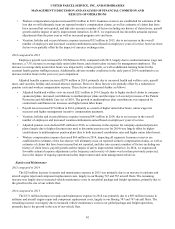
Investment Income
2015 compared to 2014
The decrease in investment income was primarily due to lower realized gains on the sale of investments in 2015
compared with 2014, and a decline in interest income. This was partially offset by a decrease in losses from fair value
adjustments on real estate partnerships.
2014 compared to 2013
The increase in investment income in 2014 compared with 2013 was primarily due to a decrease in losses from fair value
adjustments on real estate partnerships. This was partially offset by a decline in interest income, largely due to having a lower
average balance of invested assets in 2014.
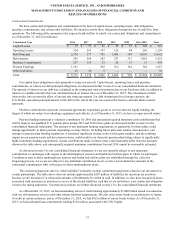
Interest Expense
2015 compared to 2014
Interest expense decreased in 2015 compared with 2014 largely due to a decrease in effective interest rates related to the
termination of our British Pound Sterling cross-currency interest rate swaps, the prior year repayment of senior notes at
maturity and the impact of foreign currency. This was partially offset by an increase in average outstanding commercial paper
and long-term debt.
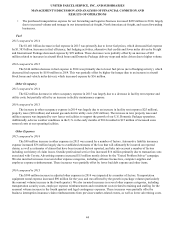
2014 compared to 2013
Interest expense decreased in 2014 compared with 2013, largely due to having a lower average balance of debt
outstanding. In addition, interest expense declined due to a decrease in the interest rate indices underlying our variable-rate
debt and swaps in 2014 compared with 2013.
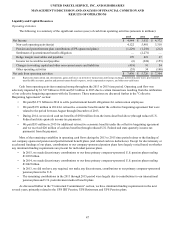
Income Tax Expense
The following table sets forth income tax expense and our effective tax rate for the years ended December 31, 2015, 2014
and 2013 (in millions):
Year Ended December 31, % Change
2015 2014 2013 2015/ 2014 2014/ 2013
Income Tax Expense : $ 2,498 $ 1,605 $ 2,302 55.6% (30.3)%
Income Tax Impact of:
Defined Benefit Plans Mark-to-Market Charge 39 392 —
Health & Welfare Plan Charges — 415 —
TNT Termination Fee and Related Expenses — — 107
Gain Upon Liquidation of Foreign Subsidiary — — (32)
Adjusted Income Tax Expense $ 2,537 $ 2,412 $ 2,377 5.2% 1.5 %
Effective Tax Rate 34.0% 34.6% 34.5%
Adjusted Effective Tax Rate 34.0% 35.5% 35.4%