UPS 2015 Annual Report Download - page 6
Download and view the complete annual report
Please find page 6 of the 2015 UPS annual report below. You can navigate through the pages in the report by either clicking on the pages listed below, or by using the keyword search tool below to find specific information within the annual report.
U.S. Domestic
In the U.S., our small package segment saw revenue
growth of 2.5 percent over the prior year. Revenue
gains were dampened by about 250 basis points,
as falling oil prices resulted in lower fuel surcharge
revenue. Year-over-year revenue growth was
partially driven by strong demand for UPS Deferred
Air products, which rose almost 14 percent, and
Next Day Air, which grew 3.3 percent. These
productsbenettedfromthecompetitivedynamics
of the fast-growing ecommerce marketplace. As
more consumers demand faster delivery of their
orders, UPS air products grew faster than ground
products in 2015.
The combination of improved pricing and network
eciency resulted in adjusted operating prot*
growth of 7.1 percent and adjusted operating margin*
expansion of 50 basis points over 2014. Improved
operating leverage was accomplished through the
implementation of technology projects like ORION
and more-ecient network management.
International
The unsteady global economy contributed to
significantcurrencydevaluationandslower
growth in many regions of the world. These macro
headwinds combined with a roughly 1,000 basis-
pointdragfromlowerfuelsurchargesandcurrency
changes pushed revenue down 6.5 percent for the
year. Total daily shipments increased 1.2 percent,
pushed higher by Export products. Total Export
shipmentgrowth in2015was3.2percent.
Disciplined pricing initiatives and improved
network management resulted in adjusted
operating profit* growth of almost 15 percent.
The adjusted operating margin* for International
expanded by 330 basis points, to 18 percent, in
part due to our ongoing hedging strategy.
As a result, the International segment recorded
its best year ever in 2015, with operating profit
topping $2 billion for the first time. We are pleased
by the consistent momentum we maintained all
year as the segment accelerated operating profit
growth in all four quarters.
0
1
2
3
4
5
20152010 2011 2012 2013 2014
GAAP Adjusted*
3.3
3.8
4.3
0.8
4.4 4.4 4.4
3.0
4.9
4.8
4.3
3.5
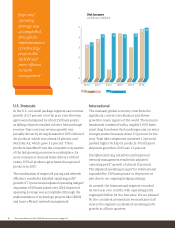
Net Income
(in billions of dollars)
“Improved
operating
leverage was
accomplished
through the
implementation
of technolo
projects like
ORION and
more-ecient
network
management.”
4*See reconciliation of Non-GAAP financial measures on page A1.
160104_L01_NARR.indd 4 3/3/16 8:58 PM

