UPS 2015 Annual Report Download - page 86
Download and view the complete annual report
Please find page 86 of the 2015 UPS annual report below. You can navigate through the pages in the report by either clicking on the pages listed below, or by using the keyword search tool below to find specific information within the annual report.-
 1
1 -
2
-
3
-
4
-
5
-
6
-
7
-
8
-
9
-
10
-
11
-
12
-
13
-
14
-
15
-
16
-
17
-
18
-
19
-
20
-
21
-
22
-
23
-
24
-
25
-
26
-
27
-
28
-
29
-
30
-
31
-
32
-
33
-
34
-
35
-
36
-
37
-
38
-
39
-
40
-
41
-
42
-
43
-
44
-
45
-
46
-
47
-
48
-
49
-
50
-
51
-
52
-
53
-
54
-
55
-
56
-
57
-
58
-
59
-
60
-
61
-
62
-
63
-
64
-
65
-
66
-
67
-
68
-
69
-
70
-
71
-
72
-
73
-
74
-
75
-
 76
76 -
 77
77 -
 78
78 -
 79
79 -
 80
80 -
 81
81 -
 82
82 -
 83
83 -
 84
84 -
 85
85 -
 86
86 -
 87
87 -
 88
88 -
 89
89 -
 90
90 -
 91
91 -
 92
92 -
 93
93 -
 94
94 -
 95
95 -
 96
96 -
97
-
98
-
99
-
100
-
101
-
102
-
103
-
104
-
105
-
106
-
107
-
108
-
109
-
110
-
111
-
112
-
113
-
114
-
115
-
116
-
117
-
118
-
119
-
120
-
121
-
122
-
123
-
124
-
125
-
126
-
127
-
128
-
129
-
130
-
131
-
132
-
133
-
134
-
135
-
136
-
137
-
138
-
139
-
140
-
141
-
142
-
143
-
144
-
145
-
146
-
147
-
148
 |
 |

UNITED PARCEL SERVICE, INC. AND SUBSIDIARIES
NOTES TO CONSOLIDATED FINANCIAL STATEMENTS
74
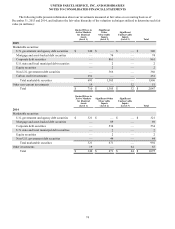
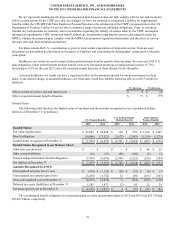
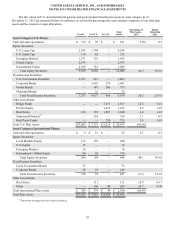
The following table presents information about our investments measured at fair value on a recurring basis as of
December 31, 2015 and 2014, and indicates the fair value hierarchy of the valuation techniques utilized to determine such fair
value (in millions):
Quoted Prices in
Active Markets
for Identical
Assets
(Level 1)
Significant
Other
Observable
Inputs
(Level 2)
Significant
Unobservable
Inputs
(Level 3) Total
2015
Marketable securities:
U.S. government and agency debt securities $ 340 $ — $ — $ 340
Mortgage and asset-backed debt securities — 74 — 74
Corporate debt securities — 861 — 861
U.S. state and local municipal debt securities — 2 — 2
Equity securities — 2 — 2
Non-U.S. government debt securities — 366 — 366
Carbon credit investments 351 — — 351
Total marketable securities 691 1,305 — 1,996
Other non-current investments 19 — 32 51
Total $ 710 $ 1,305 $ 32 $ 2,047
Quoted Prices in
Active Markets
for Identical
Assets
(Level 1)
Significant Other
Observable
Inputs
(Level 2)
Significant
Unobservable
Inputs
(Level 3) Total
2014
Marketable securities:
U.S. government and agency debt securities $ 321 $ — $ — $ 321
Mortgage and asset-backed debt securities — 89 — 89
Corporate debt securities — 534 — 534
U.S. state and local municipal debt securities —2—2
Equity securities — 2 — 2
Non-U.S. government debt securities — 44 — 44
Total marketable securities 321 671 — 992
Other investments 19 — 64 83
Total $ 340 $ 671 $ 64 $ 1,075