UPS 2015 Annual Report Download - page 47
Download and view the complete annual report
Please find page 47 of the 2015 UPS annual report below. You can navigate through the pages in the report by either clicking on the pages listed below, or by using the keyword search tool below to find specific information within the annual report.-
 1
1 -
2
-
3
-
4
-
5
-
6
-
7
-
8
-
9
-
10
-
11
-
12
-
13
-
14
-
15
-
16
-
17
-
18
-
19
-
20
-
21
-
22
-
23
-
24
-
25
-
26
-
27
-
28
-
29
-
30
-
31
-
32
-
33
-
34
-
35
-
36
-
 37
37 -
 38
38 -
 39
39 -
 40
40 -
 41
41 -
 42
42 -
 43
43 -
 44
44 -
 45
45 -
 46
46 -
 47
47 -
 48
48 -
 49
49 -
 50
50 -
 51
51 -
 52
52 -
 53
53 -
 54
54 -
 55
55 -
 56
56 -
 57
57 -
58
-
59
-
60
-
61
-
62
-
63
-
64
-
65
-
66
-
67
-
68
-
69
-
70
-
71
-
72
-
73
-
74
-
75
-
76
-
77
-
78
-
79
-
80
-
81
-
82
-
83
-
84
-
85
-
86
-
87
-
88
-
89
-
90
-
91
-
92
-
93
-
94
-
95
-
96
-
97
-
98
-
99
-
100
-
101
-
102
-
103
-
104
-
105
-
106
-
107
-
108
-
109
-
110
-
111
-
112
-
113
-
114
-
115
-
116
-
117
-
118
-
119
-
120
-
121
-
122
-
123
-
124
-
125
-
126
-
127
-
128
-
129
-
130
-
131
-
132
-
133
-
134
-
135
-
136
-
137
-
138
-
139
-
140
-
141
-
142
-
143
-
144
-
145
-
146
-
147
-
148
 |
 |
UNITED PARCEL SERVICE, INC. AND SUBSIDIARIES
MANAGEMENT'S DISCUSSION AND ANALYSIS OF FINANCIAL CONDITION AND
RESULTS OF OPERATIONS
35
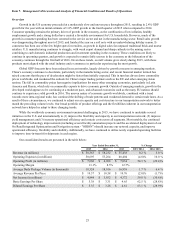
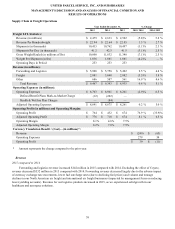
Volume
2015 compared to 2014
Our overall average daily volume increased in 2015, largely due to continued strength in business-to-consumer volume,
as well as strong demand from several sectors including healthcare and diversified vehicles and parts.
We continued to experience solid export volume growth in 2015. The growth was mainly driven by our European and
Americas operations, which experienced solid increases in volume to most regions of the world. European export volume
increased in 2015, with particular strength in the Europe-to-U.S., intra-European and Europe-to-Americas trade lanes. Americas
export volume increased in 2015, with solid growth in the Americas-to-Europe and Americas-to-U.S. trade lanes. However,
Asian export volume declined across all trade lanes due to the economic slowdown throughout the region, particularly China,
while U.S. export volume declined largely due to the impact of the stronger U.S. Dollar. Export volume growth was led by our
Transborder products, such as Transborder Standard and Transborder Express.
Domestic volume in 2015 decreased slightly from 2014 driven by selective revenue management initiatives focused on
disciplined growth. Additionally, the results were impacted by slowing overall economic conditions in Germany and Canada.
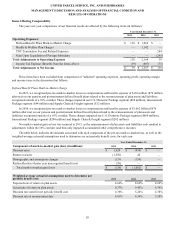
2014 compared to 2013
Our overall average daily volume increased in 2014, largely due to strong demand from several economic sectors
(including retail, healthcare, industrial and automotive).
We continued to experience strong export volume growth in 2014, with increases from all regions in the world. European
export volume increased 12% for the year, with particular strength in the intra-European trade lanes and the Europe-to-U.S.
trade lane. Asian export volume increased at a moderate pace (with strength in the Asia-to-U.S. and Asia-to-Europe trade lanes),
and benefited from technology sector product launches. Export volume continued to shift towards our standard products, such
as Transborder Standard and Worldwide Expedited, as compared with our premium express products, such as Worldwide
Express. Our international customers continue to be impacted by economic pressures and changes in their supply chain
networks, and the combination of these factors influences their sensitivity towards the price and speed of shipments.
The strong increase in domestic volume in 2014 was driven by solid volume growth in Canada, Italy, Spain, France and
the United Kingdom.
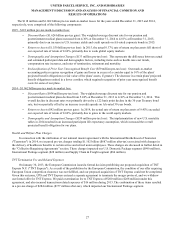
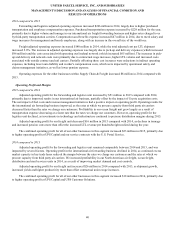
Rates and Product Mix
2015 compared to 2014
Total average revenue per piece decreased 1.4% in 2015 on a currency-adjusted basis. The decline in fuel surcharge
revenues (discussed in detail under Fuel Surcharges) more than offset the increases in base rates and revenue management
activities.
On December 29, 2014, we implemented an average 4.9% net increase in base and accessorial rates for international
shipments originating in the United States (Worldwide Express, Worldwide Saver, UPS Worldwide Expedited and UPS
International Standard service). On November 2, 2015, the surcharge increased for Over Maximum Packages and the tables for
Ground, Air and International fuel surcharges were adjusted. Rate changes for shipments originating outside the U.S. are made
throughout the year and vary by geographic market.
Currency-adjusted export revenue per piece decreased 3.7% in 2015, due to lower fuel surcharge revenues, which more
than offset the increase in base rates and disciplined yield and growth initiatives in Europe.
Currency-adjusted domestic revenue per piece increased 1.8% in 2015, largely due to base rate increases and disciplined
yield and growth initiatives in Europe and Canada, offset by declining fuel surcharge rates.