UPS 2015 Annual Report Download - page 49
Download and view the complete annual report
Please find page 49 of the 2015 UPS annual report below. You can navigate through the pages in the report by either clicking on the pages listed below, or by using the keyword search tool below to find specific information within the annual report.-
 1
1 -
2
-
3
-
4
-
5
-
6
-
7
-
8
-
9
-
10
-
11
-
12
-
13
-
14
-
15
-
16
-
17
-
18
-
19
-
20
-
21
-
22
-
23
-
24
-
25
-
26
-
27
-
28
-
29
-
30
-
31
-
32
-
33
-
34
-
35
-
36
-
37
-
38
-
 39
39 -
 40
40 -
 41
41 -
 42
42 -
 43
43 -
 44
44 -
 45
45 -
 46
46 -
 47
47 -
 48
48 -
 49
49 -
 50
50 -
 51
51 -
 52
52 -
 53
53 -
 54
54 -
 55
55 -
 56
56 -
 57
57 -
 58
58 -
 59
59 -
60
-
61
-
62
-
63
-
64
-
65
-
66
-
67
-
68
-
69
-
70
-
71
-
72
-
73
-
74
-
75
-
76
-
77
-
78
-
79
-
80
-
81
-
82
-
83
-
84
-
85
-
86
-
87
-
88
-
89
-
90
-
91
-
92
-
93
-
94
-
95
-
96
-
97
-
98
-
99
-
100
-
101
-
102
-
103
-
104
-
105
-
106
-
107
-
108
-
109
-
110
-
111
-
112
-
113
-
114
-
115
-
116
-
117
-
118
-
119
-
120
-
121
-
122
-
123
-
124
-
125
-
126
-
127
-
128
-
129
-
130
-
131
-
132
-
133
-
134
-
135
-
136
-
137
-
138
-
139
-
140
-
141
-
142
-
143
-
144
-
145
-
146
-
147
-
148
 |
 |
UNITED PARCEL SERVICE, INC. AND SUBSIDIARIES
MANAGEMENT'S DISCUSSION AND ANALYSIS OF FINANCIAL CONDITION AND
RESULTS OF OPERATIONS
37
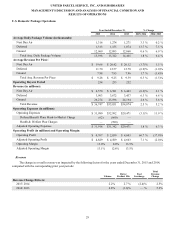
2014 compared to 2013
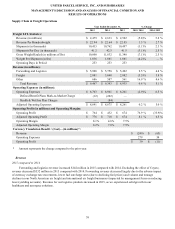
Overall adjusted operating expenses for the segment increased $450 million in 2014. This increase was driven by the cost
of pick-up and delivery, which increased $201 million, as well as the cost of operating our international integrated air and
ground network, which increased $150 million. The increases in pick-up and delivery and network costs were largely driven by
higher package volume and higher expense for outside transportation carriers (which was impacted by network capacity
constraints in Europe). However, network cost increases were mitigated by reductions in average daily aircraft block hours
(1.1% decrease in 2014), as a result of ongoing modifications to our air network; this was achieved even with a 7.8% increase
in international export volume and several air product service enhancements.
The remaining increase in adjusted operating expenses in 2014 was largely due to the costs of package sorting, which
increased $52 million, and was impacted by volume growth. Additionally, indirect operating costs increased $47 million in
2014, and were affected by various factors, including restructuring charges, foreign currency remeasurement losses, legal
contingency accruals, bad debt expense, and several other factors.
Excluding the impact of currency exchange rate changes, the total adjusted cost per piece for the segment decreased 1.6%
in 2014.
Operating Profit and Margin
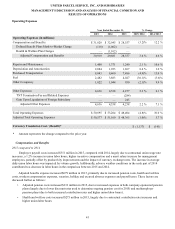
2015 compared to 2014
Adjusted operating profit increased by $276 million in 2015, while the adjusted operating margin increased 330 basis
points. Operating profit and margin were positively affected by several factors including base rate increases, modifications to
the fuel surcharge indices and the net impact of fuel (fuel expense declined at a faster rate than fuel surcharge revenue). These
items were partially offset by the net impact of currency exchange rate movements (including our currency hedging gains),
which reduced operating profit by $22 million when comparing 2015 with 2014.
2014 compared to 2013
Adjusted operating profit increased by $109 million in 2014, while the adjusted operating margin increased 20 basis
points. These increases were largely due to moderate revenue growth combined with the mitigation of expense increases
through improved productivity.
In addition to the aforementioned factors, the net impact of fuel (fuel surcharge revenue grew faster than fuel expense)
and the net impact of currency (remeasurement and translation gains) resulted in a favorable impact on operating profit of $127
million when comparing 2014 with 2013. Fuel surcharge revenue was favorably impacted during 2014 by rate increases to the
fuel surcharge index. Operating profit in 2014 was negatively impacted by $21 million due to a restructuring charge and related
costs in Europe.