UPS 2015 Annual Report Download - page 56
Download and view the complete annual report
Please find page 56 of the 2015 UPS annual report below. You can navigate through the pages in the report by either clicking on the pages listed below, or by using the keyword search tool below to find specific information within the annual report.-
 1
1 -
2
-
3
-
4
-
5
-
6
-
7
-
8
-
9
-
10
-
11
-
12
-
13
-
14
-
15
-
16
-
17
-
18
-
19
-
20
-
21
-
22
-
23
-
24
-
25
-
26
-
27
-
28
-
29
-
30
-
31
-
32
-
33
-
34
-
35
-
36
-
37
-
38
-
39
-
40
-
41
-
42
-
43
-
44
-
45
-
 46
46 -
 47
47 -
 48
48 -
 49
49 -
 50
50 -
 51
51 -
 52
52 -
 53
53 -
 54
54 -
 55
55 -
 56
56 -
 57
57 -
 58
58 -
 59
59 -
 60
60 -
 61
61 -
 62
62 -
 63
63 -
 64
64 -
 65
65 -
 66
66 -
67
-
68
-
69
-
70
-
71
-
72
-
73
-
74
-
75
-
76
-
77
-
78
-
79
-
80
-
81
-
82
-
83
-
84
-
85
-
86
-
87
-
88
-
89
-
90
-
91
-
92
-
93
-
94
-
95
-
96
-
97
-
98
-
99
-
100
-
101
-
102
-
103
-
104
-
105
-
106
-
107
-
108
-
109
-
110
-
111
-
112
-
113
-
114
-
115
-
116
-
117
-
118
-
119
-
120
-
121
-
122
-
123
-
124
-
125
-
126
-
127
-
128
-
129
-
130
-
131
-
132
-
133
-
134
-
135
-
136
-
137
-
138
-
139
-
140
-
141
-
142
-
143
-
144
-
145
-
146
-
147
-
148
 |
 |
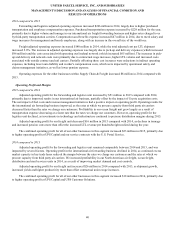
UNITED PARCEL SERVICE, INC. AND SUBSIDIARIES
MANAGEMENT'S DISCUSSION AND ANALYSIS OF FINANCIAL CONDITION AND
RESULTS OF OPERATIONS
44
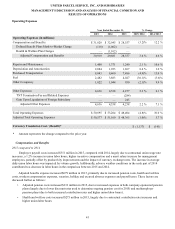
• The purchased transportation expense for our forwarding and logistics business increased $229 million in 2014, largely
due to increased volume and tonnage in our international air freight, North American air freight, and ocean forwarding
businesses.
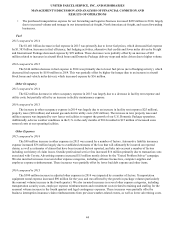
Fuel
2015 compared to 2014
The $1.401 billion decrease in fuel expense in 2015 was primarily due to lower fuel prices, which decreased fuel expense
by $1.383 billion. Increases in fuel efficiency, fuel hedging activities, alternative fuel credits and fewer miles driven by Freight
and International Package decreased expense by $99 million. These decreases were partially offset by an increase of $82
million related to increases in aircraft block hours and Domestic Package delivery stops and miles driven due to higher volume.
2014 compared to 2013
The $144 million decrease in fuel expense in 2014 was primarily due to lower fuel prices (net of hedging activity), which
decreased fuel expense by $180 million in 2014. This was partially offset by higher fuel usage (due to an increase in aircraft
block hours and vehicle miles driven), which increased expense by $36 million.
Other Occupancy
2015 compared to 2014
The $22 million decrease in other occupancy expense in 2015 was largely due to a decrease in facility rent expense and
utility costs, but partially offset by an increase in facility maintenance expense.
2014 compared to 2013
The increase in other occupancy expense in 2014 was largely due to an increase in facility rent expense ($25 million),
property taxes ($10 million) and natural gas and electric utility costs ($32 million). The increase in rent, property taxes and
utilities expense was impacted by new leases on facilities to support the growth of our U.S. Domestic Package operations.
Additionally, adverse weather conditions in the U.S. in the early months of 2014 resulted in $15 million of increased snow
removal costs at our operating facilities.
Other Expenses
2015 compared to 2014
The $98 million increase in other expenses in 2015 was caused by a number of factors. Automotive liability insurance
expense increased $36 million largely due to established estimates of the loss that will ultimately be incurred on reported
claims, as well as estimates of claims that have been incurred but not reported, and take into account a number of factors
including our history of claim losses. Outside professional service fees increased $16 million primarily due to transaction costs
associated with Coyote. Advertising expense increased $15 million mostly driven by the "United Problem Solver" campaign.
We also incurred increases in several other expense categories, including software license fees, computer supplies and
employee expense reimbursement. These increases were partially offset by lower bad debt expense and other items.
2014 compared to 2013
The $300 million increase in adjusted other expenses in 2014 was impacted by a number of factors. Transportation
equipment rental expense increased $90 million for the year, and was affected by the growth in package volume (particularly
the seasonal volume increase in the fourth quarter). We also incurred increases in several other expense categories, including
transportation security costs, employee expense reimbursements and recruitment costs (related to training and staffing for the
seasonal volume increase in the fourth quarter) and legal contingency expenses. These increases were partially offset by
business interruption insurance claim reimbursements from previous weather-related events, as well as lower advertising costs.