UPS 2014 Annual Report Download - page 93
Download and view the complete annual report
Please find page 93 of the 2014 UPS annual report below. You can navigate through the pages in the report by either clicking on the pages listed below, or by using the keyword search tool below to find specific information within the annual report.-
 1
1 -
2
-
3
-
4
-
5
-
6
-
7
-
8
-
9
-
10
-
11
-
12
-
13
-
14
-
15
-
16
-
17
-
18
-
19
-
20
-
21
-
22
-
23
-
24
-
25
-
26
-
27
-
28
-
29
-
30
-
31
-
32
-
33
-
34
-
35
-
36
-
37
-
38
-
39
-
40
-
41
-
42
-
43
-
44
-
45
-
46
-
47
-
48
-
49
-
50
-
51
-
52
-
53
-
54
-
55
-
56
-
57
-
58
-
59
-
60
-
61
-
62
-
63
-
64
-
65
-
66
-
67
-
68
-
69
-
70
-
71
-
72
-
73
-
74
-
75
-
76
-
77
-
78
-
79
-
80
-
81
-
82
-
 83
83 -
 84
84 -
 85
85 -
 86
86 -
 87
87 -
 88
88 -
 89
89 -
 90
90 -
 91
91 -
 92
92 -
 93
93 -
 94
94 -
 95
95 -
 96
96 -
 97
97 -
 98
98 -
 99
99 -
 100
100 -
 101
101 -
 102
102 -
 103
103 -
104
-
105
-
106
-
107
-
108
-
109
-
110
-
111
-
112
-
113
-
114
-
115
-
116
-
117
-
118
-
119
-
120
-
121
-
122
-
123
-
124
-
125
-
126
-
127
-
128
-
129
-
130
-
131
-
132
-
133
-
134
-
135
-
136
-
137
-
138
-
139
-
140
 |
 |

UNITED PARCEL SERVICE, INC. AND SUBSIDIARIES
NOTES TO CONSOLIDATED FINANCIAL STATEMENTS
81
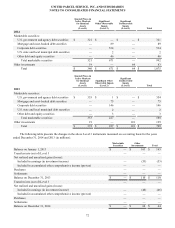
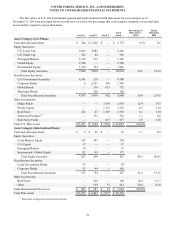
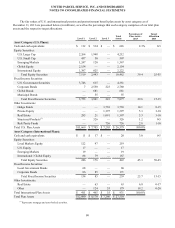
The following table presents the changes in the Level 3 instruments measured on a recurring basis for the years ended
December 31, 2014 and 2013 (in millions).
Corporate
Bonds
Hedge
Funds
Real
Estate
Private
Equity
Global
Bonds
Risk Parity
Funds Other Total
Balance on January 1, 2013 $ 138 $ 2,829 $ 1,039 $ 1,416 $ — $ 1,362 $ 49 $ 6,833
Actual Return on Assets: —
Assets Held at End of Year (1) 229 81 71 — (99) 6 287
Assets Sold During the Year — 5 54 153 — 54 — 266
Purchases 165 1,676 145 143 — 1 — 2,130
Sales (79) (1,001) (228)(386)—(562)—
(2,256)
Transfers Into (Out of) Level 3 — — — — — — — —
Balance on December 31, 2013 $ 223 $ 3,738 $ 1,091 $ 1,397 $ — $ 756 $ 55 $ 7,260
Actual Return on Assets:
Assets Held at End of Year — 71 104 11 — 61 (2) 245
Assets Sold During the Year — (9) 23 126 — — — 140
Purchases 108 1,043 350 166 735 — — 2,402
Sales (62) (1,248) (261)(377)(122)——
(2,070)
Transfers Into (Out of) Level 3 — — — — — — — —
Balance on December 31, 2014 $ 269 $ 3,595 $ 1,307 $ 1,323 $ 613 $ 817 $ 53 $ 7,977
There were no UPS class A or B shares of common stock directly held in plan assets as of December 31, 2014 or
December 31, 2013.
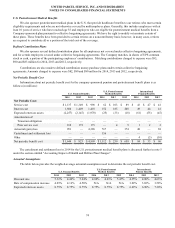
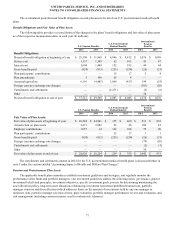
Accumulated Other Comprehensive Income
The estimated amounts of prior service cost in AOCI expected to be amortized and recognized as a component of net
periodic benefit cost in 2015 are as follows (in millions):
U.S. Pension Benefits
U.S. Postretirement
Medical Benefits
International Pension
Benefits
Prior service cost / (benefit) $ 168 $ 5 $ 1
Expected Cash Flows
Information about expected cash flows for the pension and postretirement benefit plans is as follows (in millions):
U.S.
Pension Benefits
U.S. Postretirement
Medical Benefits
International Pension
Benefits
Expected Employer Contributions:
2015 to plan trusts $ 1,030 $ — $ 69
2015 to plan participants 17 104 4
Expected Benefit Payments:
2015 $ 960 $ 245 $ 26
2016 1,052 238 25
2017 1,151 236 28
2018 1,262 231 30
2019 1,382 230 33
2020 - 2024 9,013 1,034 214
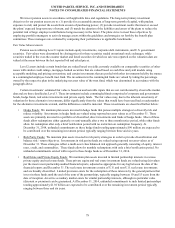
Our funding policy for U.S. plans is to contribute amounts annually that are at least equal to the amounts required by
applicable laws and regulations, or to directly fund payments to plan participants, as applicable. International plans will be
funded in accordance with local regulations. Additional discretionary contributions may be made when deemed appropriate to
meet the long-term obligations of the plans. Expected benefit payments for pensions will be primarily paid from plan trusts.
Expected benefit payments for postretirement medical benefits will be paid from plan trusts and corporate assets.