UPS 2014 Annual Report Download - page 8
Download and view the complete annual report
Please find page 8 of the 2014 UPS annual report below. You can navigate through the pages in the report by either clicking on the pages listed below, or by using the keyword search tool below to find specific information within the annual report.-
 1
1 -
 2
2 -
 3
3 -
 4
4 -
 5
5 -
 6
6 -
 7
7 -
 8
8 -
 9
9 -
 10
10 -
 11
11 -
 12
12 -
 13
13 -
 14
14 -
 15
15 -
 16
16 -
 17
17 -
 18
18 -
 19
19 -
20
-
21
-
22
-
23
-
24
-
25
-
26
-
27
-
28
-
29
-
30
-
31
-
32
-
33
-
34
-
35
-
36
-
37
-
38
-
39
-
40
-
41
-
42
-
43
-
44
-
45
-
46
-
47
-
48
-
49
-
50
-
51
-
52
-
53
-
54
-
55
-
56
-
57
-
58
-
59
-
60
-
61
-
62
-
63
-
64
-
65
-
66
-
67
-
68
-
69
-
70
-
71
-
72
-
73
-
74
-
75
-
76
-
77
-
78
-
79
-
80
-
81
-
82
-
83
-
84
-
85
-
86
-
87
-
88
-
89
-
90
-
91
-
92
-
93
-
94
-
95
-
96
-
97
-
98
-
99
-
100
-
101
-
102
-
103
-
104
-
105
-
106
-
107
-
108
-
109
-
110
-
111
-
112
-
113
-
114
-
115
-
116
-
117
-
118
-
119
-
120
-
121
-
122
-
123
-
124
-
125
-
126
-
127
-
128
-
129
-
130
-
131
-
132
-
133
-
134
-
135
-
136
-
137
-
138
-
139
-
140
 |
 |

8
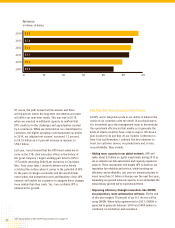
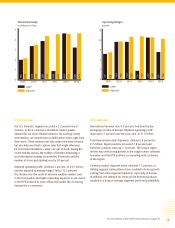
Supply Chain and Freight
The Supply Chain and Freight segment recorded a 5.1 percent
increase in revenue, to $9.4 billion. Adjusted operating
profit* increased 6.5 percent to $718 million, while adjusted
operating margin* expanded 10 basis points to 7.6 percent.
The Freight Forwarding business unit experienced solid
improvements in Ocean Forwarding and the North American
Air Freight products. However, continued excess capacity
on the major trade lanes out of Asia pressured revenue and
operating profit expansion.
Meanwhile, the Distribution business unit continues to
produce high-single-digit revenue growth and steady margin
expansion. Enhancements to UPS healthcare capabilities
around the world contributed to the improvements.
UPS Freight® continues to develop its customer base in the
U.S. and saw revenue increase 5.8 percent as a result. Freight
customers enjoy the convenience of working with an LTL
carrier that has the strength of the UPS network behind it.
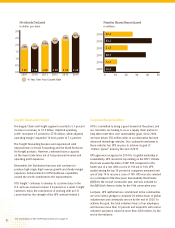
Corporate Responsibility
UPS is committed to being a good steward of the planet, and
our customers are looking to us as a supply chain partner to
help them meet their own sustainability goals. Since 2000,
we have driven 350 million miles in our alternative fuel and
advanced technology vehicles. Our continued investment in
these vehicles has UPS on pace to achieve its goal of
1 billion “green” miles by the end of 2017.
UPS again was recognized in 2014 for its global leadership in
sustainability. UPS received a top ranking on the CDP’s Climate
Disclosure Leadership Index of S&P 500 companies for the
fourth year in a row. With a score of 100 out of 100, UPS
ranked among the top 10 percent of companies measured and
one of only 14 to receive a score of 100. UPS was also selected
as a constituent of the Dow Jones Sustainability World Index
(DJSI) for the second consecutive year, and was included on
the DJSI North America Index for the 10th consecutive year.
Last June, UPS reaffirmed our commitment to the communities
we serve with a pledge to complete 20 million hours of global
volunteerism and community service by the end of 2020. To
achieve this goal, the total volunteer hours of our employees
will increase more than 12 percent and nonprofits will receive
volunteer assistance valued at more than $460 million, by the
end of the initiative.
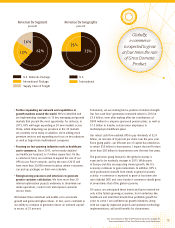
0.0
0.5
1.0
1.5
2.0
2.5
2009 2010 2011 2012 2013 2014
2.482.081.80 1.88 2.28
0.0% 4.4%
10.6%
3.0
8.8%
9.6%
2.68
8.1%
Dividends Declared
in dollars per share
% Year Over Year Growth Rate
38.7
12.4
21.8
26.4
0 1020304050
10.9
43.2
Number Shares Repurchased
in millions
2014
2009
2010
2011
2012
2013
* See reconciliation of Non-GAAP financial measures on page A1.