UPS 2014 Annual Report Download - page 55
Download and view the complete annual report
Please find page 55 of the 2014 UPS annual report below. You can navigate through the pages in the report by either clicking on the pages listed below, or by using the keyword search tool below to find specific information within the annual report.-
 1
1 -
2
-
3
-
4
-
5
-
6
-
7
-
8
-
9
-
10
-
11
-
12
-
13
-
14
-
15
-
16
-
17
-
18
-
19
-
20
-
21
-
22
-
23
-
24
-
25
-
26
-
27
-
28
-
29
-
30
-
31
-
32
-
33
-
34
-
35
-
36
-
37
-
38
-
39
-
40
-
41
-
42
-
43
-
44
-
 45
45 -
 46
46 -
 47
47 -
 48
48 -
 49
49 -
 50
50 -
 51
51 -
 52
52 -
 53
53 -
 54
54 -
 55
55 -
 56
56 -
 57
57 -
 58
58 -
 59
59 -
 60
60 -
 61
61 -
 62
62 -
 63
63 -
 64
64 -
 65
65 -
66
-
67
-
68
-
69
-
70
-
71
-
72
-
73
-
74
-
75
-
76
-
77
-
78
-
79
-
80
-
81
-
82
-
83
-
84
-
85
-
86
-
87
-
88
-
89
-
90
-
91
-
92
-
93
-
94
-
95
-
96
-
97
-
98
-
99
-
100
-
101
-
102
-
103
-
104
-
105
-
106
-
107
-
108
-
109
-
110
-
111
-
112
-
113
-
114
-
115
-
116
-
117
-
118
-
119
-
120
-
121
-
122
-
123
-
124
-
125
-
126
-
127
-
128
-
129
-
130
-
131
-
132
-
133
-
134
-
135
-
136
-
137
-
138
-
139
-
140
 |
 |
UNITED PARCEL SERVICE, INC. AND SUBSIDIARIES
MANAGEMENT'S DISCUSSION AND ANALYSIS OF FINANCIAL CONDITION AND
RESULTS OF OPERATIONS
43
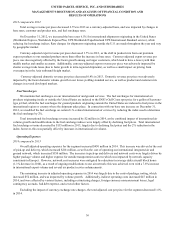
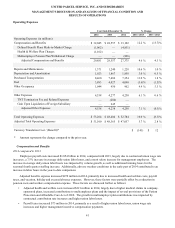
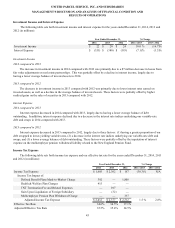
Depreciation and Amortization
2014 compared to 2013
The increase in depreciation and amortization expense in 2014, compared with 2013, was primarily due to a $45 million
increase in the depreciation expense on vehicles, due to the replacement of older, fully-depreciated vehicles, technology
upgrades on vehicles and an overall increase in the size of our vehicle fleet in our U.S. Domestic Package and UPS Freight
operations. Additionally, amortization expense increased $20 million, primarily related to intangible assets resulting from
business acquisitions. These factors were partially offset by a decrease in building and facility depreciation, as several
operating facilities became fully-depreciated.
2013 compared to 2012
The increase in depreciation and amortization expense in 2013, compared with 2012, was primarily due to a $62 million
increase in depreciation expense on vehicles. This increase was driven by the replacement of older, fully-depreciated vehicles,
technology upgrades on new vehicles and an overall increase in the size of our vehicle fleet. This increase was largely offset by
several factors, including lower building and facility depreciation and capitalized software amortization.
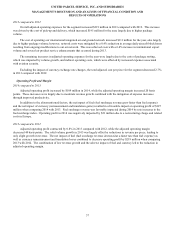
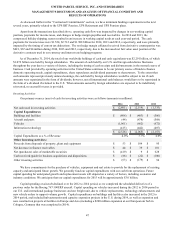
Purchased Transportation
2014 compared to 2013
The $974 million increase in purchased transportation expense charged to us by third-party air, ocean and truck carriers in
2014 was driven by several factors:
• Our U.S. Domestic Package segment incurred a $474 million increase in expense in 2014, primarily due to (1) higher
fees paid to the U.S. Postal Service associated with the volume growth in our SurePost product; (2) the increased use
of, and higher rates passed to us from, rail carriers; and (3) the increased use of outside contract carriers, which was
impacted by volume growth and rail carrier service issues; additionally, adverse weather conditions in the early months
of 2014 resulted in the additional use of outside contract carriers. Approximately $177 million of the increase, or 37%
of the total increase for the year, was attributable to the fourth quarter as a result of high seasonal volume.
• Our International Package segment incurred a $203 million increase in expense in 2014, primarily due to higher costs
incurred for the use of outside transportation providers, which was impacted by strong international volume growth.
• Our UPS Freight business incurred a $68 million increase in expense in 2014, largely due to increased LTL and
brokerage volume, and the resulting increased use of, and higher rates passed to us from, outside transportation
carriers.
• The purchased transportation expense for our forwarding and logistics business increased $229 million in 2014, largely
due to increased volume and tonnage in our international air freight, North American air freight, and ocean forwarding
businesses.
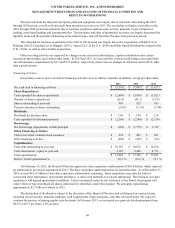
2013 compared to 2012
The increase in purchased transportation expense charged to us by third-party air, ocean and truck carriers in 2013,
compared with 2012, was driven by several factors:
• Our U.S. Domestic Package segment incurred a $154 million expense increase for the year, primarily due to higher
rates passed to us from rail carriers, and higher fees paid to the U.S. Postal Service associated with the volume growth
in our SurePost product. This increase in expense was also impacted by the adverse weather conditions in the fourth
quarter of 2013, as well as the significant increase in volume during the compressed timing of the holiday season.
• Our International Package segment incurred a $144 million expense increase for the year, primarily due to
international volume growth.
• Our UPS Freight business incurred a $70 million increase for the year, largely due to growth in LTL volume and
higher rates passed to us from rail carriers.
• The purchased transportation expense for our forwarding & logistics business declined $236 million for the year,
largely due to lower tonnage and reduced rates from third-party transportation carriers in our international air freight
forwarding business.