UPS 2014 Annual Report Download - page 36
Download and view the complete annual report
Please find page 36 of the 2014 UPS annual report below. You can navigate through the pages in the report by either clicking on the pages listed below, or by using the keyword search tool below to find specific information within the annual report.-
 1
1 -
2
-
3
-
4
-
5
-
6
-
7
-
8
-
9
-
10
-
11
-
12
-
13
-
14
-
15
-
16
-
17
-
18
-
19
-
20
-
21
-
22
-
23
-
24
-
25
-
 26
26 -
 27
27 -
 28
28 -
 29
29 -
 30
30 -
 31
31 -
 32
32 -
 33
33 -
 34
34 -
 35
35 -
 36
36 -
 37
37 -
 38
38 -
 39
39 -
 40
40 -
 41
41 -
 42
42 -
 43
43 -
 44
44 -
 45
45 -
 46
46 -
47
-
48
-
49
-
50
-
51
-
52
-
53
-
54
-
55
-
56
-
57
-
58
-
59
-
60
-
61
-
62
-
63
-
64
-
65
-
66
-
67
-
68
-
69
-
70
-
71
-
72
-
73
-
74
-
75
-
76
-
77
-
78
-
79
-
80
-
81
-
82
-
83
-
84
-
85
-
86
-
87
-
88
-
89
-
90
-
91
-
92
-
93
-
94
-
95
-
96
-
97
-
98
-
99
-
100
-
101
-
102
-
103
-
104
-
105
-
106
-
107
-
108
-
109
-
110
-
111
-
112
-
113
-
114
-
115
-
116
-
117
-
118
-
119
-
120
-
121
-
122
-
123
-
124
-
125
-
126
-
127
-
128
-
129
-
130
-
131
-
132
-
133
-
134
-
135
-
136
-
137
-
138
-
139
-
140
 |
 |

24
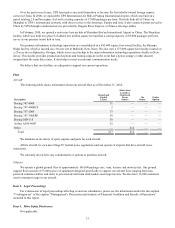
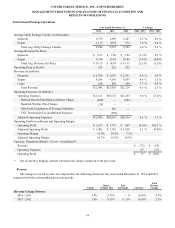
Item 6. Selected Financial Data
The following table sets forth selected financial data for each of the five years in the period ended December 31, 2014 (in
millions, except per share amounts). This financial data should be read together with our consolidated financial statements and
related notes, Management’s Discussion and Analysis of Financial Condition and Results of Operations, and other financial
data appearing elsewhere in this report.
Years Ended December 31,
2014 2013 2012 2011 2010
Selected Income Statement Data
Revenue:
U.S. Domestic Package $ 35,851 $ 34,074 $ 32,856 $ 31,717 $ 29,742
International Package 12,988 12,429 12,124 12,249 11,133
Supply Chain & Freight 9,393 8,935 9,147 9,139 8,670
Total revenue 58,232 55,438 54,127 53,105 49,545
Operating expenses:
Compensation and benefits 32,045 28,557 33,102 27,575 26,557
Other 21,219 19,847 19,682 19,450 17,347
Total operating expenses 53,264 48,404 52,784 47,025 43,904
Operating profit:
U.S. Domestic Package 2,859 4,603 459 3,764 3,238
International Package 1,677 1,757 869 1,709 1,831
Supply Chain and Freight 432 674 15 607 572
Total operating profit 4,968 7,034 1,343 6,080 5,641
Other income (expense):
Investment income 22 20 24 44 3
Interest expense (353)(380)(393)(348)(354)
Income before income taxes 4,637 6,674 974 5,776 5,290
Income tax expense 1,605 2,302 167 1,972 1,952
Net income $ 3,032 $ 4,372 $ 807 $ 3,804 $ 3,338
Per share amounts:
Basic earnings per share $ 3.31 $ 4.65 $ 0.84 $ 3.88 $ 3.36
Diluted earnings per share $ 3.28 $ 4.61 $ 0.83 $ 3.84 $ 3.33
Dividends declared per share $ 2.68 $ 2.48 $ 2.28 $ 2.08 $ 1.88
Weighted average shares outstanding:
Basic 916 940 960 981 994
Diluted 924 948 969 991 1,003
As of December 31,
2014 2013 2012 2011 2010
Selected Balance Sheet Data
Cash and marketable securities $ 3,283 $ 5,245 $ 7,924 $ 4,275 $ 4,081
Total assets 35,471 36,212 38,863 34,701 33,597
Long-term debt 9,864 10,824 11,089 11,095 10,491
Shareowners’ equity 2,158 6,488 4,733 7,108 8,047