UPS 2014 Annual Report Download - page 56
Download and view the complete annual report
Please find page 56 of the 2014 UPS annual report below. You can navigate through the pages in the report by either clicking on the pages listed below, or by using the keyword search tool below to find specific information within the annual report.-
 1
1 -
2
-
3
-
4
-
5
-
6
-
7
-
8
-
9
-
10
-
11
-
12
-
13
-
14
-
15
-
16
-
17
-
18
-
19
-
20
-
21
-
22
-
23
-
24
-
25
-
26
-
27
-
28
-
29
-
30
-
31
-
32
-
33
-
34
-
35
-
36
-
37
-
38
-
39
-
40
-
41
-
42
-
43
-
44
-
45
-
 46
46 -
 47
47 -
 48
48 -
 49
49 -
 50
50 -
 51
51 -
 52
52 -
 53
53 -
 54
54 -
 55
55 -
 56
56 -
 57
57 -
 58
58 -
 59
59 -
 60
60 -
 61
61 -
 62
62 -
 63
63 -
 64
64 -
 65
65 -
 66
66 -
67
-
68
-
69
-
70
-
71
-
72
-
73
-
74
-
75
-
76
-
77
-
78
-
79
-
80
-
81
-
82
-
83
-
84
-
85
-
86
-
87
-
88
-
89
-
90
-
91
-
92
-
93
-
94
-
95
-
96
-
97
-
98
-
99
-
100
-
101
-
102
-
103
-
104
-
105
-
106
-
107
-
108
-
109
-
110
-
111
-
112
-
113
-
114
-
115
-
116
-
117
-
118
-
119
-
120
-
121
-
122
-
123
-
124
-
125
-
126
-
127
-
128
-
129
-
130
-
131
-
132
-
133
-
134
-
135
-
136
-
137
-
138
-
139
-
140
 |
 |
UNITED PARCEL SERVICE, INC. AND SUBSIDIARIES
MANAGEMENT'S DISCUSSION AND ANALYSIS OF FINANCIAL CONDITION AND
RESULTS OF OPERATIONS
44
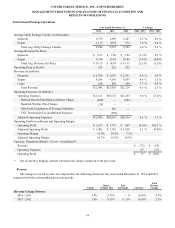
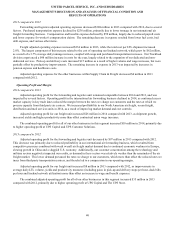
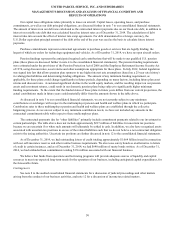
Fuel
2014 compared to 2013
The $144 million decrease in fuel expense in 2014 was primarily due to lower fuel prices (net of hedging activity), which
decreased fuel expense by $180 million in 2014. This was partially offset by higher fuel usage (due to an increase in aircraft
block hours and vehicle miles driven), which increased expense by $36 million.
2013 compared to 2012
The decrease in fuel expense in 2013 was largely due to the decline in fuel prices (primarily jet-A fuel prices), which
decreased expense by $77 million, net of hedging. This was partially offset by a $14 million increase in overall fuel usage,
which was primarily due to lower vehicle fuel efficiency and an increase in miles driven.
Other Occupancy
2014 compared to 2013
The increase in other occupancy expense in 2014 was largely due to an increase in facility rent expense ($25 million),
property taxes ($10 million) and natural gas and electric utility costs ($32 million). The increase in rent, property taxes and
utilities expense was impacted by new leases on facilities to support the growth of our U.S. Domestic Package operations.
Additionally, adverse weather conditions in the U.S. in the early months of 2014 resulted in $15 million of increased snow
removal costs at our operating facilities.
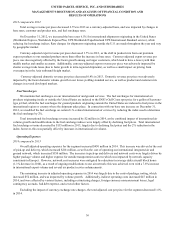
2013 compared to 2012
The increase in other occupancy expense in 2013, compared with 2012, was primarily due to higher snow removal costs
at our operating facilities, an increase in utility expenses, as well as higher real estate taxes. The relatively cold winter in the
United States in 2013 compared with 2012 caused the increase in snow removal costs, while increased usage and higher prices
of natural gas and electricity resulted in the increase in utility expenses.
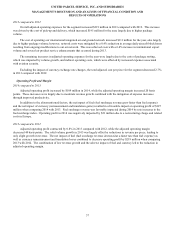
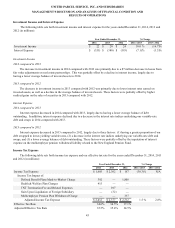
Other Expenses
2014 compared to 2013
The $300 million increase in adjusted other expenses in 2014 was impacted by a number of factors. Transportation
equipment rental expense increased $90 million for the year, and was affected by the growth in package volume (particularly
the seasonal volume increase in the fourth quarter). We also incurred increases in several other expense categories, including
transportation security costs, employee expense reimbursements and recruitment costs (related to training and staffing for the
seasonal volume increase in the fourth quarter) and legal contingency expenses. These increases were partially offset by
business interruption insurance claim reimbursements from previous weather-related events, as well as lower advertising costs.
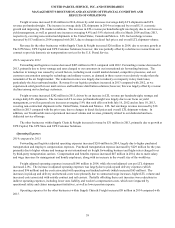
2013 compared to 2012
The decrease in adjusted other expenses in 2013 compared with 2012 was impacted by a number of factors, including
decreases in bad debt expense, employee expense reimbursements, advertising costs, telecommunications expenses, and non-
income based state and local taxes. These decreases in expense were partially offset by increases in auto liability insurance,
transportation equipment rentals, and air cargo handling costs.