UPS 2014 Annual Report Download - page 84
Download and view the complete annual report
Please find page 84 of the 2014 UPS annual report below. You can navigate through the pages in the report by either clicking on the pages listed below, or by using the keyword search tool below to find specific information within the annual report.-
 1
1 -
2
-
3
-
4
-
5
-
6
-
7
-
8
-
9
-
10
-
11
-
12
-
13
-
14
-
15
-
16
-
17
-
18
-
19
-
20
-
21
-
22
-
23
-
24
-
25
-
26
-
27
-
28
-
29
-
30
-
31
-
32
-
33
-
34
-
35
-
36
-
37
-
38
-
39
-
40
-
41
-
42
-
43
-
44
-
45
-
46
-
47
-
48
-
49
-
50
-
51
-
52
-
53
-
54
-
55
-
56
-
57
-
58
-
59
-
60
-
61
-
62
-
63
-
64
-
65
-
66
-
67
-
68
-
69
-
70
-
71
-
72
-
73
-
 74
74 -
 75
75 -
 76
76 -
 77
77 -
 78
78 -
 79
79 -
 80
80 -
 81
81 -
 82
82 -
 83
83 -
 84
84 -
 85
85 -
 86
86 -
 87
87 -
 88
88 -
 89
89 -
 90
90 -
 91
91 -
 92
92 -
 93
93 -
 94
94 -
95
-
96
-
97
-
98
-
99
-
100
-
101
-
102
-
103
-
104
-
105
-
106
-
107
-
108
-
109
-
110
-
111
-
112
-
113
-
114
-
115
-
116
-
117
-
118
-
119
-
120
-
121
-
122
-
123
-
124
-
125
-
126
-
127
-
128
-
129
-
130
-
131
-
132
-
133
-
134
-
135
-
136
-
137
-
138
-
139
-
140
 |
 |

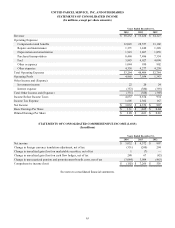
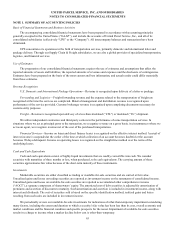
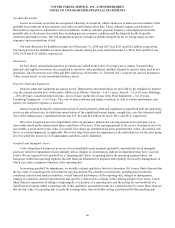
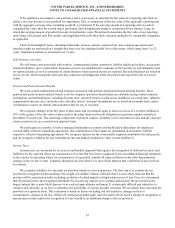
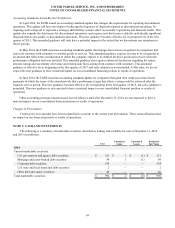
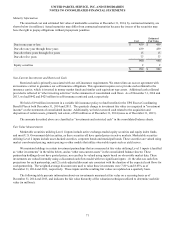
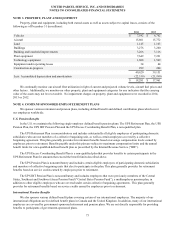
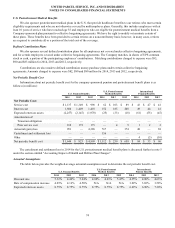
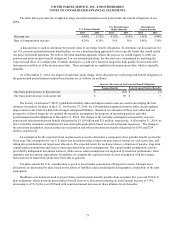
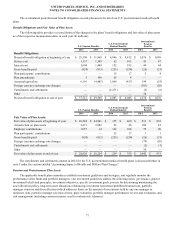
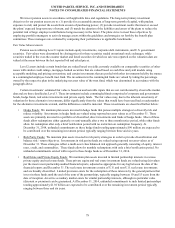
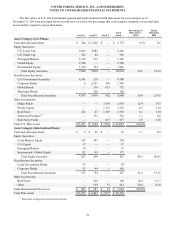
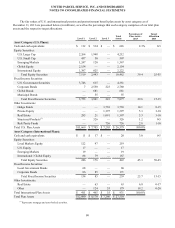
UNITED PARCEL SERVICE, INC. AND SUBSIDIARIES
NOTES TO CONSOLIDATED FINANCIAL STATEMENTS
72
Quoted Prices in
Active Markets
for Identical
Assets
(Level 1)
Significant
Other Observable
Inputs
(Level 2)
Significant
Unobservable
Inputs
(Level 3) Total
2014
Marketable securities:
U.S. government and agency debt securities $ 321 $ — $ — $ 321
Mortgage and asset-backed debt securities — 89 — 89
Corporate debt securities — 534 — 534
U.S. state and local municipal debt securities —2— 2
Other debt and equity securities — 46 — 46
Total marketable securities 321 671 — 992
Other investments 19 — 64 83
Total $ 340 $ 671 $ 64 $ 1,075
Quoted Prices in
Active Markets
for Identical
Assets
(Level 1)
Significant Other
Observable Inputs
(Level 2)
Significant
Unobservable
Inputs
(Level 3) Total
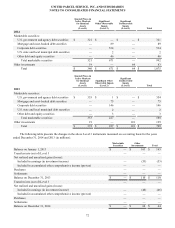
2013
Marketable securities:
U.S. government and agency debt securities $ 353 $ 1 $ — $ 354
Mortgage and asset-backed debt securities — 75 — 75
Corporate debt securities — 146 — 146
U.S. state and local municipal debt securities —2— 2
Other debt and equity securities — 3 — 3
Total marketable securities 353 227 — 580
Other investments 19 — 110 129
Total $ 372 $ 227 $ 110 $ 709
The following table presents the changes in the above Level 3 instruments measured on a recurring basis for the years
ended December 31, 2014 and 2013 (in millions).
Marketable
Securities
Other
Investments Total
Balance on January 1, 2013 $ — $ 163 $ 163
Transfers into (out of) Level 3 — — —
Net realized and unrealized gains (losses):
Included in earnings (in investment income) — (53)(53)
Included in accumulated other comprehensive income (pre-tax) — — —
Purchases ———
Settlements ———
Balance on December 31, 2013 $ — $ 110 $ 110
Transfers into (out of) Level 3 — — —
Net realized and unrealized gains (losses):
Included in earnings (in investment income) — (46)(46)
Included in accumulated other comprehensive income (pre-tax) — — —
Purchases ———
Settlements ———
Balance on December 31, 2014 $ — $ 64 $ 64