UPS 2014 Annual Report Download - page 91
Download and view the complete annual report
Please find page 91 of the 2014 UPS annual report below. You can navigate through the pages in the report by either clicking on the pages listed below, or by using the keyword search tool below to find specific information within the annual report.-
 1
1 -
2
-
3
-
4
-
5
-
6
-
7
-
8
-
9
-
10
-
11
-
12
-
13
-
14
-
15
-
16
-
17
-
18
-
19
-
20
-
21
-
22
-
23
-
24
-
25
-
26
-
27
-
28
-
29
-
30
-
31
-
32
-
33
-
34
-
35
-
36
-
37
-
38
-
39
-
40
-
41
-
42
-
43
-
44
-
45
-
46
-
47
-
48
-
49
-
50
-
51
-
52
-
53
-
54
-
55
-
56
-
57
-
58
-
59
-
60
-
61
-
62
-
63
-
64
-
65
-
66
-
67
-
68
-
69
-
70
-
71
-
72
-
73
-
74
-
75
-
76
-
77
-
78
-
79
-
80
-
 81
81 -
 82
82 -
 83
83 -
 84
84 -
 85
85 -
 86
86 -
 87
87 -
 88
88 -
 89
89 -
 90
90 -
 91
91 -
 92
92 -
 93
93 -
 94
94 -
 95
95 -
 96
96 -
 97
97 -
 98
98 -
 99
99 -
 100
100 -
 101
101 -
102
-
103
-
104
-
105
-
106
-
107
-
108
-
109
-
110
-
111
-
112
-
113
-
114
-
115
-
116
-
117
-
118
-
119
-
120
-
121
-
122
-
123
-
124
-
125
-
126
-
127
-
128
-
129
-
130
-
131
-
132
-
133
-
134
-
135
-
136
-
137
-
138
-
139
-
140
 |
 |

UNITED PARCEL SERVICE, INC. AND SUBSIDIARIES
NOTES TO CONSOLIDATED FINANCIAL STATEMENTS
79
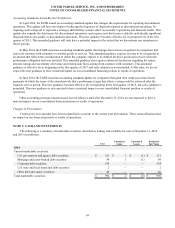
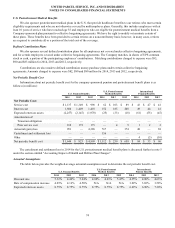
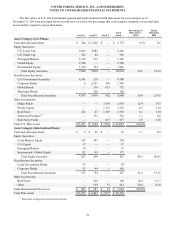
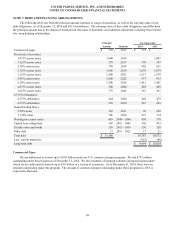
The fair values of U.S. and international pension and postretirement benefit plan assets by asset category as of
December 31, 2014 are presented below (in millions), as well as the percentage that each category comprises of our total plan
assets and the respective target allocations.
Level 1 Level 2 Level 3
Total
Assets
Percentage of
Plan Assets -
2014
Target
Allocation
2014
Asset Category (U.S. Plans):
Cash and cash equivalents $ 744 $ 1,028 $ — $ 1,772 6.1% 0-5
Equity Securities:
U.S. Large Cap 2,066 2,082 — 4,148
U.S. Small Cap 322 44 — 366
Emerging Markets 1,270 116 — 1,386
Global Equity 2,788 — — 2,788
International Equity 1,154 792 — 1,946
Total Equity Securities 7,600 3,034 — 10,634 36.6 35-55
Fixed Income Securities:
U.S. Government Securities 4,541 239 — 4,780
Corporate Bonds 6 2,921 269 3,196
Global Bonds — 159 613 772
Municipal Bonds — 100 — 100
Total Fixed Income Securities 4,547 3,419 882 8,848 30.4 25-35
Other Investments:
Hedge Funds — — 3,595 3,595 12.4 5-15
Private Equity — — 1,323 1,323 4.5 1-10
Real Estate 412 47 1,307 1,766 6.1 1-10
Structured Products(1) — 332 — 332 1.1 0-5
Risk Parity Funds — — 817 817 2.8 1-10
Total U.S. Plan Assets $13,303 $ 7,860 $ 7,924 $ 29,087 100.0%
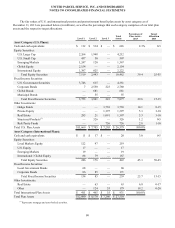
Asset Category (International Plans):
Cash and cash equivalents $ 6 $ 26 $ — 32 3.1 0-5
Equity Securities:
Local Markets Equity 145 105 — 250
U.S. Equity 17 — — 17
Emerging Markets 19 — — 19
International / Global Equity 82 95 — 177
Total Equity Securities 263 200 — 463 44.3 50-65
Fixed Income Securities:
Local Government Bonds 78 — — 78
Corporate Bonds 55 94 — 149
Total Fixed Income Securities 133 94 — 227 21.8 15-35
Other Investments:
Real Estate — 108 — 108 10.4 0-17
Other — 159 53 212 20.4 0-20
Total International Plan Assets $ 402 $ 587 $ 53 $ 1,042 100.0%
Total Plan Assets $13,705 $ 8,447 $ 7,977 $ 30,129
(1) Represents mortgage and asset-backed securities.