UPS 2014 Annual Report Download - page 87
Download and view the complete annual report
Please find page 87 of the 2014 UPS annual report below. You can navigate through the pages in the report by either clicking on the pages listed below, or by using the keyword search tool below to find specific information within the annual report.-
 1
1 -
2
-
3
-
4
-
5
-
6
-
7
-
8
-
9
-
10
-
11
-
12
-
13
-
14
-
15
-
16
-
17
-
18
-
19
-
20
-
21
-
22
-
23
-
24
-
25
-
26
-
27
-
28
-
29
-
30
-
31
-
32
-
33
-
34
-
35
-
36
-
37
-
38
-
39
-
40
-
41
-
42
-
43
-
44
-
45
-
46
-
47
-
48
-
49
-
50
-
51
-
52
-
53
-
54
-
55
-
56
-
57
-
58
-
59
-
60
-
61
-
62
-
63
-
64
-
65
-
66
-
67
-
68
-
69
-
70
-
71
-
72
-
73
-
74
-
75
-
76
-
 77
77 -
 78
78 -
 79
79 -
 80
80 -
 81
81 -
 82
82 -
 83
83 -
 84
84 -
 85
85 -
 86
86 -
 87
87 -
 88
88 -
 89
89 -
 90
90 -
 91
91 -
 92
92 -
 93
93 -
 94
94 -
 95
95 -
 96
96 -
 97
97 -
98
-
99
-
100
-
101
-
102
-
103
-
104
-
105
-
106
-
107
-
108
-
109
-
110
-
111
-
112
-
113
-
114
-
115
-
116
-
117
-
118
-
119
-
120
-
121
-
122
-
123
-
124
-
125
-
126
-
127
-
128
-
129
-
130
-
131
-
132
-
133
-
134
-
135
-
136
-
137
-
138
-
139
-
140
 |
 |

UNITED PARCEL SERVICE, INC. AND SUBSIDIARIES
NOTES TO CONSOLIDATED FINANCIAL STATEMENTS
75
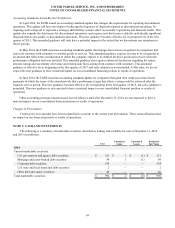
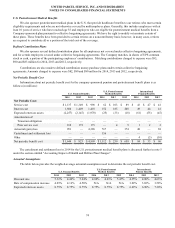
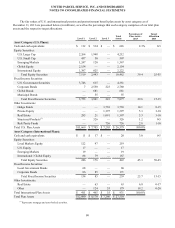
The table below provides the weighted-average actuarial assumptions used to determine the benefit obligations of our
plans.
U.S. Pension Benefits
U.S. Postretirement
Medical Benefits
International
Pension Benefits
2014 2013 2014 2013 2014 2013
Discount rate 4.40% 5.32% 4.18% 5.14% 3.56% 4.40%
Rate of compensation increase 4.29% 4.29% N/A N/A 3.08% 3.30%
A discount rate is used to determine the present value of our future benefit obligations. To determine our discount rate for
our U.S. pension and postretirement benefit plans, we use a bond matching approach to select specific bonds that would satisfy
our projected benefit payments. We believe the bond matching approach reflects the process we would employ to settle our
pension and postretirement benefit obligations. For our international plans, the discount rate is determined by matching the
expected cash flows of a sample plan of similar duration to a yield curve based on long-term, high quality fixed income debt
instruments available as of the measurement date. These assumptions are updated each measurement date, which is typically
annually.
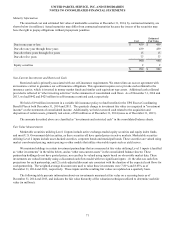
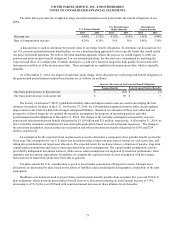
As of December 31, 2014, the impact of each basis point change in the discount rate on the projected benefit obligation of
the pension and postretirement medical benefit plans are as follows (in millions):
Increase (Decrease) in the Projected Benefit Obligation
Pension Benefits Postretirement Medical Benefits
One basis point increase in discount rate $ (65)$ (3)
One basis point decrease in discount rate $ 69 $ 3
The Society of Actuaries' ("SOA") published mortality tables and improvement scales are used in developing the best
estimate of mortality for plans in the U.S. On October 27, 2014, the SOA published updated mortality tables and an updated
improvement scale, both of which reflect longer anticipated lifetimes. Based on an evaluation of these new tables and our
perspective of future longevity, we updated the mortality assumptions for purposes of measuring pension and other
postretirement benefit obligations at December 31, 2014. The change to the mortality assumption increased the year-end
pension and other postretirement benefit obligations by $1.119 billion and $51 million, respectively. At December 31, 2014, we
also revised the retirement assumptions for non-union plan participants based on recent retirement experience. The change to
the retirement assumption decreased the year-end pension and other postretirement benefit obligations by $383 and $234
million, respectively.
An assumption for the expected return on plan assets is used to determine a component of net periodic benefit cost for the
fiscal year. This assumption for our U.S. plans was developed using a long-term projection of returns for each asset class, and
taking into consideration our target asset allocation. The expected return for each asset class is a function of passive, long-term
capital market assumptions and excess returns generated from active management. The capital market assumptions used are
provided by independent investment advisors, while excess return assumptions are supported by historical performance, fund
mandates and investment expectations. In addition, we compare the expected return on asset assumption with the average
historical rate of return these plans have been able to generate.
For plans outside the U.S., consideration is given to local market expectations of long-term returns. Strategic asset
allocations are determined by plan, based on the nature of liabilities and considering the demographic composition of the plan
participants.
Healthcare cost trends are used to project future postretirement benefits payable from our plans. For year-end 2014 U.S.
plan obligations, future postretirement medical benefit costs were forecasted assuming an initial annual increase of 7.0%,
decreasing to 4.5% by the year 2020 and with consistent annual increases at those ultimate levels thereafter.