UPS 2014 Annual Report Download - page 7
Download and view the complete annual report
Please find page 7 of the 2014 UPS annual report below. You can navigate through the pages in the report by either clicking on the pages listed below, or by using the keyword search tool below to find specific information within the annual report.-
 1
1 -
 2
2 -
 3
3 -
 4
4 -
 5
5 -
 6
6 -
 7
7 -
 8
8 -
 9
9 -
 10
10 -
 11
11 -
 12
12 -
 13
13 -
 14
14 -
 15
15 -
 16
16 -
 17
17 -
 18
18 -
19
-
20
-
21
-
22
-
23
-
24
-
25
-
26
-
27
-
28
-
29
-
30
-
31
-
32
-
33
-
34
-
35
-
36
-
37
-
38
-
39
-
40
-
41
-
42
-
43
-
44
-
45
-
46
-
47
-
48
-
49
-
50
-
51
-
52
-
53
-
54
-
55
-
56
-
57
-
58
-
59
-
60
-
61
-
62
-
63
-
64
-
65
-
66
-
67
-
68
-
69
-
70
-
71
-
72
-
73
-
74
-
75
-
76
-
77
-
78
-
79
-
80
-
81
-
82
-
83
-
84
-
85
-
86
-
87
-
88
-
89
-
90
-
91
-
92
-
93
-
94
-
95
-
96
-
97
-
98
-
99
-
100
-
101
-
102
-
103
-
104
-
105
-
106
-
107
-
108
-
109
-
110
-
111
-
112
-
113
-
114
-
115
-
116
-
117
-
118
-
119
-
120
-
121
-
122
-
123
-
124
-
125
-
126
-
127
-
128
-
129
-
130
-
131
-
132
-
133
-
134
-
135
-
136
-
137
-
138
-
139
-
140
 |
 |

7
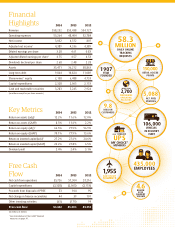
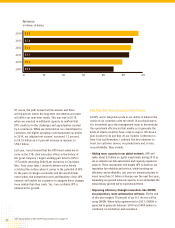
U.S. Domestic
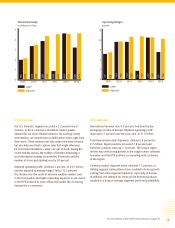
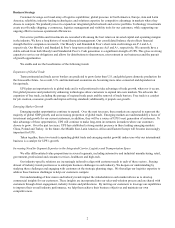
Our U.S. Domestic segment recorded a 5.2 percent rise in
revenue, as the e-commerce revolution creates greater
demand for our omni-channel solutions. By working closely
with retailers, we enable them to fulfill online orders right from
their stores. These solutions not only reduce the time in transit,
but also help merchants capture sales that might otherwise
be lost if their distribution centers are out of stock. During the
recent holiday season, the number of retailers employing a
local distribution strategy increased by 50 percent and the
number of stores participating rose by 30 percent.
Adjusted operating profit* declined 2 percent, to $4.5 billion,
and the adjusted operating margin* fell to 12.6 percent.
The decline was the result of extreme weather-related costs
in the first quarter and higher operating expenses as we invest
in the UPS network to more efficiently handle the increasing
demand for e-commerce.
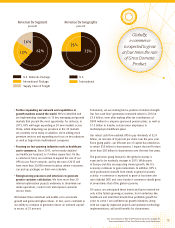
International
International revenue rose 4.5 percent, bolstered by the
emerging recovery in Europe. Adjusted operating profit*
improved 6.1 percent over the prior year, to $1.9 billion.
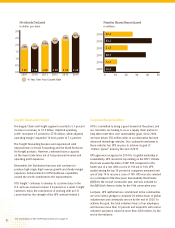
Total International daily shipments climbed 6.4 percent to
2.7 million. Export products increased 7.8 percent and
Domestic products were up 5.3 percent. The Europe region
led the way with strong growth as the supply-chain continues
to evolve and the UPS portfolio is resonating with customers
in the region.
Currency-neutral shipment yields declined 1.5 percent, as
shifting regional trade patterns have resulted in faster growth
coming from intra-regional shipments, especially in Europe.
In addition, the demand for lower-priced deferred products
resulted in a drag on average shipment yield and profitability.
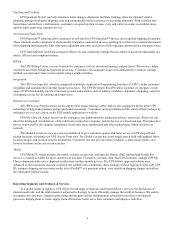
Diluted Earnings
in dollars per share
2009 2010 2011 2012 2013
0
1
2
3
4
5
2014
GAAP
Adjusted*
1.96
2.13
3.33
3.48
3.84
4.35
0.83
4.53
4.61
4.57
3.28
4.75
Operating Margin
percent
0
3
6
9
12
15
2009 2010 2011 2012 2013 2014
GAAP
Adjusted*
7.7
8.2
11.4
11.5
11.4
12.9
2.5
13.1
12.7
12.8
8.5
12.2
* See reconciliation of Non-GAAP financial measures on page A1.