UPS 2014 Annual Report Download - page 116
Download and view the complete annual report
Please find page 116 of the 2014 UPS annual report below. You can navigate through the pages in the report by either clicking on the pages listed below, or by using the keyword search tool below to find specific information within the annual report.-
 1
1 -
2
-
3
-
4
-
5
-
6
-
7
-
8
-
9
-
10
-
11
-
12
-
13
-
14
-
15
-
16
-
17
-
18
-
19
-
20
-
21
-
22
-
23
-
24
-
25
-
26
-
27
-
28
-
29
-
30
-
31
-
32
-
33
-
34
-
35
-
36
-
37
-
38
-
39
-
40
-
41
-
42
-
43
-
44
-
45
-
46
-
47
-
48
-
49
-
50
-
51
-
52
-
53
-
54
-
55
-
56
-
57
-
58
-
59
-
60
-
61
-
62
-
63
-
64
-
65
-
66
-
67
-
68
-
69
-
70
-
71
-
72
-
73
-
74
-
75
-
76
-
77
-
78
-
79
-
80
-
81
-
82
-
83
-
84
-
85
-
86
-
87
-
88
-
89
-
90
-
91
-
92
-
93
-
94
-
95
-
96
-
97
-
98
-
99
-
100
-
101
-
102
-
103
-
104
-
105
-
 106
106 -
 107
107 -
 108
108 -
 109
109 -
 110
110 -
 111
111 -
 112
112 -
 113
113 -
 114
114 -
 115
115 -
 116
116 -
 117
117 -
 118
118 -
 119
119 -
 120
120 -
 121
121 -
 122
122 -
 123
123 -
 124
124 -
 125
125 -
 126
126 -
127
-
128
-
129
-
130
-
131
-
132
-
133
-
134
-
135
-
136
-
137
-
138
-
139
-
140
 |
 |

UNITED PARCEL SERVICE, INC. AND SUBSIDIARIES
NOTES TO CONSOLIDATED FINANCIAL STATEMENTS
104
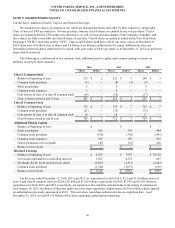
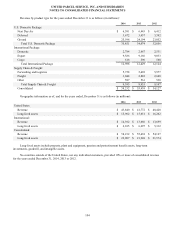
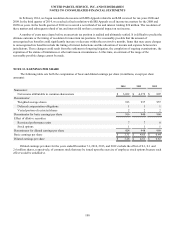
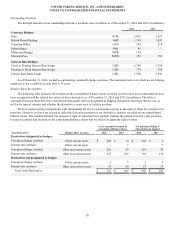
Revenue by product type for the years ended December 31 is as follows (in millions):
2014 2013 2012
U.S. Domestic Package:
Next Day Air $ 6,581 $ 6,443 $ 6,412
Deferred 3,672 3,437 3,392
Ground 25,598 24,194 23,052
Total U.S. Domestic Package 35,851 34,074 32,856
International Package:
Domestic 2,784 2,667 2,531
Export 9,586 9,166 9,033
Cargo 618 596 560
Total International Package 12,988 12,429 12,124
Supply Chain & Freight:
Forwarding and Logistics 5,758 5,492 5,977
Freight 3,048 2,882 2,640
Other 587 561 530
Total Supply Chain & Freight 9,393 8,935 9,147
Consolidated $ 58,232 $ 55,438 $ 54,127
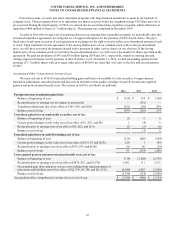
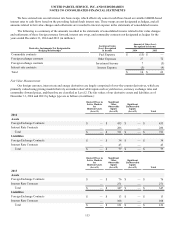
Geographic information as of, and for the years ended, December 31 is as follows (in millions):
2014 2013 2012
United States:
Revenue $ 43,840 $ 41,772 $ 40,428
Long-lived assets $ 15,902 $ 15,651 $ 16,262
International:
Revenue $ 14,392 $ 13,666 $ 13,699
Long-lived assets $ 6,105 $ 6,297 $ 5,312
Consolidated:
Revenue $ 58,232 $ 55,438 $ 54,127
Long-lived assets $ 22,007 $ 21,948 $ 21,574
Long-lived assets include property, plant and equipment, pension and postretirement benefit assets, long-term
investments, goodwill, and intangible assets.
No countries outside of the United States, nor any individual customers, provided 10% or more of consolidated revenue
for the years ended December 31, 2014, 2013 or 2012.