UPS 2014 Annual Report Download - page 47
Download and view the complete annual report
Please find page 47 of the 2014 UPS annual report below. You can navigate through the pages in the report by either clicking on the pages listed below, or by using the keyword search tool below to find specific information within the annual report.-
 1
1 -
2
-
3
-
4
-
5
-
6
-
7
-
8
-
9
-
10
-
11
-
12
-
13
-
14
-
15
-
16
-
17
-
18
-
19
-
20
-
21
-
22
-
23
-
24
-
25
-
26
-
27
-
28
-
29
-
30
-
31
-
32
-
33
-
34
-
35
-
36
-
 37
37 -
 38
38 -
 39
39 -
 40
40 -
 41
41 -
 42
42 -
 43
43 -
 44
44 -
 45
45 -
 46
46 -
 47
47 -
 48
48 -
 49
49 -
 50
50 -
 51
51 -
 52
52 -
 53
53 -
 54
54 -
 55
55 -
 56
56 -
 57
57 -
58
-
59
-
60
-
61
-
62
-
63
-
64
-
65
-
66
-
67
-
68
-
69
-
70
-
71
-
72
-
73
-
74
-
75
-
76
-
77
-
78
-
79
-
80
-
81
-
82
-
83
-
84
-
85
-
86
-
87
-
88
-
89
-
90
-
91
-
92
-
93
-
94
-
95
-
96
-
97
-
98
-
99
-
100
-
101
-
102
-
103
-
104
-
105
-
106
-
107
-
108
-
109
-
110
-
111
-
112
-
113
-
114
-
115
-
116
-
117
-
118
-
119
-
120
-
121
-
122
-
123
-
124
-
125
-
126
-
127
-
128
-
129
-
130
-
131
-
132
-
133
-
134
-
135
-
136
-
137
-
138
-
139
-
140
 |
 |
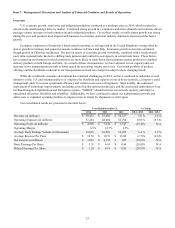
UNITED PARCEL SERVICE, INC. AND SUBSIDIARIES
MANAGEMENT'S DISCUSSION AND ANALYSIS OF FINANCIAL CONDITION AND
RESULTS OF OPERATIONS
35
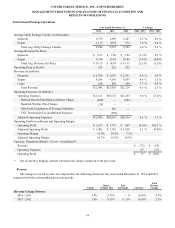
Volume
2014 compared to 2013
Our overall average daily volume increased in 2014, largely due to strong demand from several economic sectors
(including retail, healthcare, industrial and automotive).
We continued to experience strong export volume growth in 2014, with increases from all regions in the world. European
export volume increased 12% for the year, with particular strength in the intra-European trade lanes and the Europe-to-U.S.
trade lane. Asian export volume increased at a moderate pace (with strength in the Asia-to-U.S. and Asia-to-Europe trade
lanes), and benefited from technology sector product launches. Export volume continued to shift towards our standard
products, such as Transborder Standard and Worldwide Expedited, as compared with our premium express products, such as
Worldwide Express. Our international customers continue to be impacted by economic pressures and changes in their supply
chain networks, and the combination of these factors influences their sensitivity towards the price and speed of shipments.
The strong increase in domestic volume in 2014 was driven by solid volume growth in Canada, Italy, Spain, France and
the United Kingdom.
2013 compared to 2012
Our overall average daily volume increased in 2013 compared with 2012, largely due to growth in key markets in Europe,
as well as Canada and Mexico.
Export volume increased in 2013, and was driven by Europe (largely in the intra-European trade lanes) and the Americas
(particularly in the Canada-to-U.S. and Mexico-to-U.S. trade lanes). Asian export volume grew at a moderate pace due to
continued regional economic growth and expansion of our service offerings, but was negatively impacted by fewer technology
product launches from our customers and a small number of competitive losses. Volume continued to shift towards our
standard products, such as Transborder Standard and Worldwide Expedited, as compared with our premium express products,
such as Worldwide Express.
Domestic volume increased in 2013 compared to 2012, and was driven by solid volume growth in several key markets,
including Italy, Canada, Poland and Turkey.
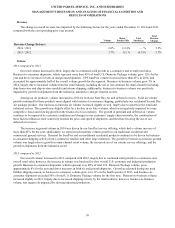
Rates and Product Mix
2014 compared to 2013
Total average revenue per piece decreased 1.5% in 2014 on a currency-adjusted basis, and was impacted by changes in
base rates as well as product mix.
On December 30, 2013, we implemented an average 4.9% net increase in base and accessorial rates for international
shipments originating in the United States (Worldwide Express, Worldwide Saver, UPS Worldwide Expedited and UPS
International Standard service). Rate changes for shipments originating outside the U.S. are made throughout the year and vary
by geographic market.
Currency-adjusted export revenue per piece decreased 3.1% in 2014, as the shift in product mix from our premium
express products to our standard products more than offset the increase in base rates (volume for our standard products
increased 12%, while volume for our premium express products increased 4%). Additionally, currency-adjusted export revenue
per piece was adversely impacted by shorter average trade lanes (due to faster growth in intra-regional shipments) and changes
in customer mix (as export volume growth for larger customers exceeded the volume growth for higher-yielding middle market
customers).
Currency-adjusted domestic revenue per piece increased 0.3% in 2014, and was impacted by base rate increases, as well
as changes in product mix and fuel surcharge rates.