UPS 2014 Annual Report Download - page 42
Download and view the complete annual report
Please find page 42 of the 2014 UPS annual report below. You can navigate through the pages in the report by either clicking on the pages listed below, or by using the keyword search tool below to find specific information within the annual report.-
 1
1 -
2
-
3
-
4
-
5
-
6
-
7
-
8
-
9
-
10
-
11
-
12
-
13
-
14
-
15
-
16
-
17
-
18
-
19
-
20
-
21
-
22
-
23
-
24
-
25
-
26
-
27
-
28
-
29
-
30
-
31
-
 32
32 -
 33
33 -
 34
34 -
 35
35 -
 36
36 -
 37
37 -
 38
38 -
 39
39 -
 40
40 -
 41
41 -
 42
42 -
 43
43 -
 44
44 -
 45
45 -
 46
46 -
 47
47 -
 48
48 -
 49
49 -
 50
50 -
 51
51 -
 52
52 -
53
-
54
-
55
-
56
-
57
-
58
-
59
-
60
-
61
-
62
-
63
-
64
-
65
-
66
-
67
-
68
-
69
-
70
-
71
-
72
-
73
-
74
-
75
-
76
-
77
-
78
-
79
-
80
-
81
-
82
-
83
-
84
-
85
-
86
-
87
-
88
-
89
-
90
-
91
-
92
-
93
-
94
-
95
-
96
-
97
-
98
-
99
-
100
-
101
-
102
-
103
-
104
-
105
-
106
-
107
-
108
-
109
-
110
-
111
-
112
-
113
-
114
-
115
-
116
-
117
-
118
-
119
-
120
-
121
-
122
-
123
-
124
-
125
-
126
-
127
-
128
-
129
-
130
-
131
-
132
-
133
-
134
-
135
-
136
-
137
-
138
-
139
-
140
 |
 |

UNITED PARCEL SERVICE, INC. AND SUBSIDIARIES
MANAGEMENT'S DISCUSSION AND ANALYSIS OF FINANCIAL CONDITION AND
RESULTS OF OPERATIONS
30
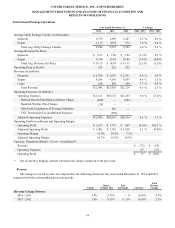
Revenue
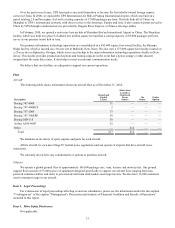
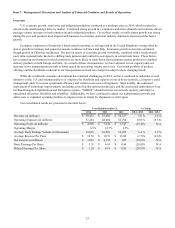
The change in overall revenue was impacted by the following factors for the years ended December 31, 2014 and 2013,
compared with the corresponding prior year periods:
Volume
Rates /
Product Mix
Fuel
Surcharge
Total
Revenue
Change
Revenue Change Drivers:
2014 / 2013 6.8% (1.6)% — % 5.2%
2013 / 2012 3.7% 0.5 % (0.5)% 3.7%
Volume
2014 compared to 2013
Our total volume increased in 2014, largely due to continued solid growth in e-commerce and overall retail sales.
Business-to-consumer shipments, which represent more than 45% of total U.S. Domestic Package volume, grew 12% for the
year and drove increases in both air and ground shipments. UPS SurePost volume increased more than 45% in 2014, and
accounted for approximately half of the overall volume growth for the segment. Business-to-business volume grew 3% in
2014, largely due to increased volume from the retail industry, including the use of our solutions for omni-channel (including
ship-from-store and ship-to-store models) and returns shipping; additionally, business-to-business volume was positively
impacted by growth in shipments from the industrial, automotive and government sectors.
Among our air products, volume increased in 2014 for both our Next Day Air and deferred services. Solid air volume
growth continued for those products most aligned with business-to-consumer shipping, particularly our residential Second Day
Air package product. Our business-to-business air volume increased slightly as well, largely due to growth in the retail and
industrial sectors. This growth was slightly offset by a decline in air letter volume, which was negatively impacted by some
competitive losses and slowing growth in the financial services industry. The growth in premium and deferred air volume
continues to be impacted by economic conditions and changes in our customers' supply chain networks; the combination of
these factors influences their sensitivity towards the price and speed of shipments, and therefore favoring the use of our
deferred air services.
The increase in ground volume in 2014 was driven by our SurePost service offering, which had a volume increase of
more than 45% for the year; additionally, we experienced moderate volume growth in our traditional residential and
commercial ground services. Demand for SurePost and our traditional residential products continues to be driven by business-
to-consumer shipping activity from e-commerce retailers and other large customers. The growth in business-to-business ground
volume was largely due to growth in omni-channel retail volume, the increased use of our returns service offerings, and the
growth in shipments from the industrial sector.
2013 compared to 2012
Our overall volume increased in 2013 compared with 2012, largely due to continued solid growth in e-commerce and
overall retail sales; however, the increase in volume was hindered by slow overall U.S. economic and industrial production
growth. Business-to-consumer shipments, which represent over 40% of total U.S. Domestic Package volume, grew
approximately 8% for the year and drove increases in both air and ground shipments. Growth accelerated during our peak
holiday shipping season, as business-to-consumer volume grew over 11% in the fourth quarter of 2013, and business-to-
consumer shipments exceeded 50% of total U.S. Domestic Package volume for the first time. Business-to-business volume
increased slightly in 2013, largely due to increased shipping activity by the retail industry; however, business-to-business
volume was negatively impacted by slowing industrial production.