UPS 2014 Annual Report Download - page 6
Download and view the complete annual report
Please find page 6 of the 2014 UPS annual report below. You can navigate through the pages in the report by either clicking on the pages listed below, or by using the keyword search tool below to find specific information within the annual report.-
 1
1 -
 2
2 -
 3
3 -
 4
4 -
 5
5 -
 6
6 -
 7
7 -
 8
8 -
 9
9 -
 10
10 -
 11
11 -
 12
12 -
 13
13 -
 14
14 -
 15
15 -
 16
16 -
 17
17 -
18
-
19
-
20
-
21
-
22
-
23
-
24
-
25
-
26
-
27
-
28
-
29
-
30
-
31
-
32
-
33
-
34
-
35
-
36
-
37
-
38
-
39
-
40
-
41
-
42
-
43
-
44
-
45
-
46
-
47
-
48
-
49
-
50
-
51
-
52
-
53
-
54
-
55
-
56
-
57
-
58
-
59
-
60
-
61
-
62
-
63
-
64
-
65
-
66
-
67
-
68
-
69
-
70
-
71
-
72
-
73
-
74
-
75
-
76
-
77
-
78
-
79
-
80
-
81
-
82
-
83
-
84
-
85
-
86
-
87
-
88
-
89
-
90
-
91
-
92
-
93
-
94
-
95
-
96
-
97
-
98
-
99
-
100
-
101
-
102
-
103
-
104
-
105
-
106
-
107
-
108
-
109
-
110
-
111
-
112
-
113
-
114
-
115
-
116
-
117
-
118
-
119
-
120
-
121
-
122
-
123
-
124
-
125
-
126
-
127
-
128
-
129
-
130
-
131
-
132
-
133
-
134
-
135
-
136
-
137
-
138
-
139
-
140
 |
 |

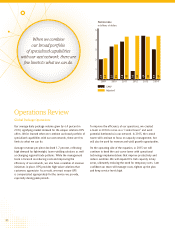
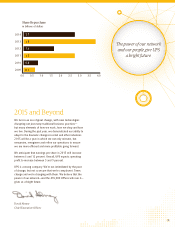
When we combine
our broad portfolio
of specialized capabilities
with our vast network, there are
few limits to what we can do.
6
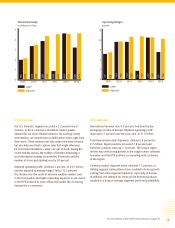
Operations Review
Global Package Operations
Our average daily package volume grew by 6.4 percent in
2014, signifying market demand for the unique solutions UPS
offers. We’ve learned when we combine our broad portfolio of
specialized capabilities with our vast network, there are few
limits to what we can do.
Average revenue per piece declined 1.7 percent, reflecting
high demand for lightweight, lower-yielding solutions as well
as changing regional trade patterns. While the management
team is focused on reducing costs and improving the
efficiency of our network, we also have a number of revenue
initiatives in place. UPS provides high-value solutions that
customers appreciate. As a result, we must ensure UPS
is compensated appropriately for the service we provide,
especially during peak periods.
To improve the efficiency of our operations, we created
a team in 2014 to serve as a “control tower” and avert
potential bottlenecks in our network. In 2015, the control
tower will continue to focus on capacity management, but
will also be used for revenue and yield growth opportunities.
On the operating side of the equation, in 2015 we will
continue to bend the cost-curve lower with operational
technology implementations that improve productivity and
reduce overtime. We will expand U.S. hub capacity in key
areas, ultimately reducing the need for temporary sorts. I am
confident our team will manage costs, tighten up the plan
and keep service levels high.
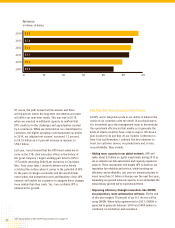
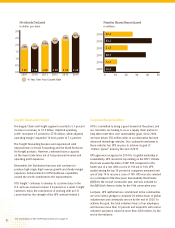
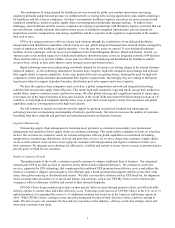
Net Income
in billions of dollars
0
1
2
3
4
5
20142009 2010 2011 2012 2013
GAAP
Adjusted*
2.0
2.1
3.3
3.5
3.8
3.0
0.8
4.4
4.4
4.3
4.4
4.3