UPS 2014 Annual Report Download - page 137
Download and view the complete annual report
Please find page 137 of the 2014 UPS annual report below. You can navigate through the pages in the report by either clicking on the pages listed below, or by using the keyword search tool below to find specific information within the annual report.-
 1
1 -
2
-
3
-
4
-
5
-
6
-
7
-
8
-
9
-
10
-
11
-
12
-
13
-
14
-
15
-
16
-
17
-
18
-
19
-
20
-
21
-
22
-
23
-
24
-
25
-
26
-
27
-
28
-
29
-
30
-
31
-
32
-
33
-
34
-
35
-
36
-
37
-
38
-
39
-
40
-
41
-
42
-
43
-
44
-
45
-
46
-
47
-
48
-
49
-
50
-
51
-
52
-
53
-
54
-
55
-
56
-
57
-
58
-
59
-
60
-
61
-
62
-
63
-
64
-
65
-
66
-
67
-
68
-
69
-
70
-
71
-
72
-
73
-
74
-
75
-
76
-
77
-
78
-
79
-
80
-
81
-
82
-
83
-
84
-
85
-
86
-
87
-
88
-
89
-
90
-
91
-
92
-
93
-
94
-
95
-
96
-
97
-
98
-
99
-
100
-
101
-
102
-
103
-
104
-
105
-
106
-
107
-
108
-
109
-
110
-
111
-
112
-
113
-
114
-
115
-
116
-
117
-
118
-
119
-
120
-
121
-
122
-
123
-
124
-
125
-
126
-
 127
127 -
 128
128 -
 129
129 -
 130
130 -
 131
131 -
 132
132 -
 133
133 -
 134
134 -
 135
135 -
 136
136 -
 137
137 -
 138
138 -
 139
139 -
 140
140
 |
 |

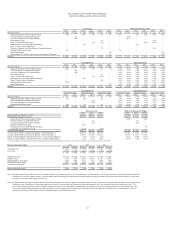
Reconciliation of Non-GAAP Financial Measures
(amounts in millions, except per share amounts)
2014 2013 2012 2011 2010 2009 2014 2013 2012 2011 2010 2009
Reported / GAAP 3,032$ 4,372$ 807$ 3,804$ 3,338$ 1,968$3.28$4.61$0.83$3.84$3.33$1.96$
Defined Benefit Plans Mark-to-Market Charge 670 - 3,023 527 75 11 0.73 - 3.12 0.53 0.07 0.01
TNTTerminationFeeandRelatedExpenses -177---- -0.19----
Gain Upon Liquidation of Foreign Subsidiar
y
- (213) ---- -(0.23)----
RestructuringCharge ---- 64- ----0.06-
GainsonRealEstateTransactions ---(20)(61)- ---(0.02)(0.06)-
Multiemployer Pension Plan Withdrawal Charge - - 559 - - - - - 0.58 - - -
Gains/LossesonSalesofBusinesses ---- 3- ------
Charge for Change in Tax Filing Status for German Subsidiar
y
---- 76- ----0.08-
Health&WelfarePlanCharges 687----- 0.74-----
Aircraft Impairmen
t
-----116-----0.11
RemeasurmentofCertainForeign-CurrencyDenominatedObligations ----- 48-----0.05
Adjusted 4,389$ 4,336$ 4,389$ 4,311$ 3,495$ 2,143$4.75$4.57$4.53$4.35$3.48$2.13$
2014 2013 2012 2011 2010 2009 2014 2013 2012 2011 2010 2009
Reported / GAAP 4,968$ 7,034$ 1,343$ 6,080$ 5,641$ 3,508$ 8.5% 12.7% 2.5% 11.4% 11.4% 7.7%
Defined Benefit Plans Mark-to-Market Charge 1,062 - 4,831 827 112 16 1.8% 0.0% 8.9% 1.6% 0.2% 0.1%
TNTTerminationFeeandRelatedExpenses -284---- 0.0%0.5%0.0%0.0%0.0%0.0%
Gain Upon Liquidation of Foreign Subsidiar
y
- (245) ---- 0.0%-0.4%0.0%0.0%0.0%0.0%
RestructuringCharge ---- 98- 0.0%0.0%0.0%0.0%0.2%0.0%
GainsonRealEstateTransactions ---(33)(109) - 0.0% 0.0% 0.0% -0.1% -0.2% 0.0%
Multiemployer Pension Plan Withdrawal Charge - - 896 - - - 0.0% 0.0% 1.7% 0.0% 0.0% 0.0%
Gains/LossesonSalesofBusinesses ----(20)- 0.0%0.0%0.0%0.0%-0.1%0.0%
Health&WelfarePlanCharges 1,102----- 1.9%0.0%0.0%0.0%0.0%0.0%
Aircraft Impairmen
t
-----1810.0%0.0%0.0%0.0%0.0%0.4%
Adjusted 7,132$ 7,073$ 7,070$ 6,874$ 5,722$ 3,705$ 12.2% 12.8% 13.1% 12.9% 11.5% 8.2%
2014 2013 2014 2013 2014 2013 2014 2013 2014 2013 2014 2013
Reported / GAAP 2,859$ 4,603$ 1,677$ 1,757$ 432$ 674$ 8.0% 13.5% 12.9% 14.1% 4.6% 7.5%
Defined Benefit Plans Mark-to-Market Charge 660 - 200 - 202 - 1.8% 0.0% 1.6% 0.0% 2.1% 0.0%
TNT Termination Fee and Related Expenses - - - 284 - - 0.0% 0.0% 0.0% 2.3% 0.0% 0.0%
Gain Upon Liquidation of Foreign Subsidiar
y
- - - (245) - - 0.0% 0.0% 0.0% -1.9% 0.0% 0.0%
Health & Welfare Plan Charges 990 - 28 - 84 - 2.8% 0.0% 0.2% 0.0% 0.9% 0.0%
Adjusted 4,509$ 4,603$ 1,905$ 1,796$ 718$ 674$ 12.6% 13.5% 14.7% 14.5% 7.6% 7.5%
2014 2013 2012 2014 2013 2012
Beginning Balance (Reported / GAAP) 36,212$ 38,863$ 34,701$ 6,488$ 4,733$ 7,108$
Ending Balance (Reported / GAAP) 35,471$ 36,212$ 38,863$ 2,158$ 6,488$ 4,733$
Defined Benefit Plans Mark-to-Market Charge - - - 4,546 * - 3,023
TNT Termination Fee and Related Expenses - 177 - - 177 -
Gain Upon Liquidation of Foreign Subsidiar
y
- (213) - - (213) -
Health & Welfare Plan Charges 1,417 - - - - -
Multiemployer Pension Plan Withdrawal Charge - - - - - 559
Long-Term U.S. Deferred Tax Assets (1,113) - (559) - - -
Adjusted Ending Balance 35,775$ 36,176$ 38,304$ 6,704$ 6,452$ 8,315$
Average Reported Balance ((Reported Beginning + Reported Ending) / 2) 35,842$ 37,538$ 36,782$ 4,323$ 5,611$ 5,921$
Average Adjusted Balance ((Reported Beginning + Adjusted Ending) / 2) 35,994$ 37,520$ 36,503$ 6,596$ 5,593$ 7,712$
Return on Reported Balance (Reported Net Income / Average Reported Balance) 8.5% 11.6% 2.2% 70.1% 77.9% 13.6%
Return on Adjusted Balance (Adjusted Net Income / Average Adjusted Balance) 12.2% 11.6% 12.0% 66.5% 77.5% 56.9%
* Note: 2014 includes the entire pension and postretirement benefit plan remeasurement (amounts both inside and outside the 10% corridor). 2013 and 2012 reflect only amounts outside the 10% corridor.
Return on Invested Capital
Reported Adjusted Reported Adjusted Reported Adjusted
Operating Profi
t
4,968$ 7,132$ 7,034$ 7,073$ 1,343$ 7,070$
Less: Taxes (1,719) (2,532) (2,427) (2,504) (230) (2,439)
3,249$ 4,600$ 4,607$ 4,569$ 1,113$ 4,631$
Beginning LT Deb
t
10,824$ 10,824$ 11,089$ 11,089$ 11,095$ 11,095$
Ending LT Deb
t
9,864 9,864 10,824 10,824 11,089 11,089
Beginning Shareowners' Equit
y
6,488 6,488 4,733 4,733 7,108 7,108
Ending Shareowners' Equit
y
2,158 6,704 6,488 6,452 4,733 8,315
Average Invested Capita
l
14,667$ 16,940$ 16,567$ 16,549$ 17,013$ 18,804$
Return on Invested Capita
l
22.2% 27.2% 27.8% 27.6% 6.5% 24.6%
Note: The adjustments denoted in the tables above are further described in our annual reports on Form 10-K for the years ended December 31, 2014, 2013 and 2012, as well as in the historical financial
schedules on our investor relations website. The taxes deducted from operating profit in the return on invested capital calculation are based on the reported and adjusted effective tax rates noted
on page 45 of our 2014 annual report on Form 10-K.
Note: We supplement the reporting of our financial information determined under Generally Accepted Accounting Principles ("GAAP") with certain non-GAAP financial measures, including net income,
earnings per share, operating profit, operating margin, return on assets, return on equity, and return on invested capital adjusted for the non-comparable items listed in the tables above. We
believe these adjusted measures provide meaningful information to assist investors and analysts in understanding our financial results and assessing our prospects for future performance. We
believe these adjusted financial measures are important indicators of our recurring results of operations because they exclude items that may not be indicative of, or are unrelated to, our core
operating results, and provide a better baseline for analyzing trends in our underlying businesses.
Net Income
Supply Chain & Freight
Return on Shareowners' Equity
2014 2013
Return on Assets
2012
Diluted Earnings Per Share
Operating Profit Operating Margin
Operating Profit
U.S. Domestic Package International Package Supply Chain & Freight
Operating Margin
U.S. Domestic Package International Package
A1