UPS 2014 Annual Report Download - page 44
Download and view the complete annual report
Please find page 44 of the 2014 UPS annual report below. You can navigate through the pages in the report by either clicking on the pages listed below, or by using the keyword search tool below to find specific information within the annual report.-
 1
1 -
2
-
3
-
4
-
5
-
6
-
7
-
8
-
9
-
10
-
11
-
12
-
13
-
14
-
15
-
16
-
17
-
18
-
19
-
20
-
21
-
22
-
23
-
24
-
25
-
26
-
27
-
28
-
29
-
30
-
31
-
32
-
33
-
 34
34 -
 35
35 -
 36
36 -
 37
37 -
 38
38 -
 39
39 -
 40
40 -
 41
41 -
 42
42 -
 43
43 -
 44
44 -
 45
45 -
 46
46 -
 47
47 -
 48
48 -
 49
49 -
 50
50 -
 51
51 -
 52
52 -
 53
53 -
 54
54 -
55
-
56
-
57
-
58
-
59
-
60
-
61
-
62
-
63
-
64
-
65
-
66
-
67
-
68
-
69
-
70
-
71
-
72
-
73
-
74
-
75
-
76
-
77
-
78
-
79
-
80
-
81
-
82
-
83
-
84
-
85
-
86
-
87
-
88
-
89
-
90
-
91
-
92
-
93
-
94
-
95
-
96
-
97
-
98
-
99
-
100
-
101
-
102
-
103
-
104
-
105
-
106
-
107
-
108
-
109
-
110
-
111
-
112
-
113
-
114
-
115
-
116
-
117
-
118
-
119
-
120
-
121
-
122
-
123
-
124
-
125
-
126
-
127
-
128
-
129
-
130
-
131
-
132
-
133
-
134
-
135
-
136
-
137
-
138
-
139
-
140
 |
 |

UNITED PARCEL SERVICE, INC. AND SUBSIDIARIES
MANAGEMENT'S DISCUSSION AND ANALYSIS OF FINANCIAL CONDITION AND
RESULTS OF OPERATIONS
32
Ground revenue per piece increased in 2013 compared with 2012, primarily due to the base rate increase; however, this
was partially offset by customer and product mix changes, as a greater portion of our overall volume in 2013, relative to 2012,
came from lighter-weight shipments and larger customers. Fuel surcharge rate changes adversely impacted ground revenue per
piece growth in 2013 compared with 2012.
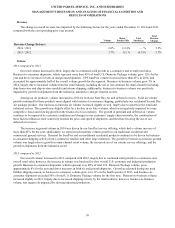
Fuel Surcharges
UPS applies a fuel surcharge on our domestic air and ground services. The air fuel surcharge is based on the U.S.
Department of Energy’s (“DOE”) Gulf Coast spot price for a gallon of kerosene-type jet fuel, while the ground fuel surcharge is
based on the DOE’s On-Highway Diesel Fuel Price. In connection with our base rate increase on December 31, 2012, we
modified the fuel surcharge on air and ground services by reducing the index used to determine the fuel surcharge by 2% and
1%, respectively. Based on published rates, the average fuel surcharge rates for domestic air and ground products were as
follows:
Year Ended December 31, % Point Change
2014 2013 2012 2014 / 2013 2013 / 2012
Next Day Air / Deferred 10.2% 10.7% 13.0% (0.5)% (2.3)%
Ground 7.1% 7.2% 8.0% (0.1)% (0.8)%
Total fuel surcharge revenue declined by $8 million in 2014, as lower fuel surcharge rates (driven by lower fuel prices)
slightly more than offset the impact of increased air and ground volume. In 2013, total fuel surcharge revenue declined by
$178 million due to lower fuel surcharge rates (driven primarily by the reductions in the index on both the air and ground
surcharges, as well as lower fuel prices).
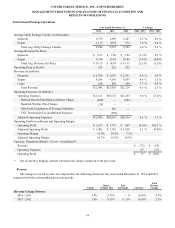
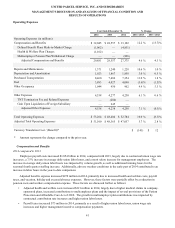
Operating Expenses
2014 compared to 2013
Adjusted operating expenses for the segment increased $1.871 billion in 2014, primarily due to pick-up and delivery
costs (up $821 million), the cost of operating our domestic integrated air and ground network (up $719 million) and the costs of
package sorting (up $167 million). These costs were impacted by several factors:
• We incurred higher employee compensation costs, largely resulting from an increase in average daily union labor
hours (up 7.5%), union contractual wage rate increases, increased employee healthcare expenses and growth in the
overall size of the workforce. The increase in labor hours was driven by volume growth, additional overtime and
training hours during our fourth quarter holiday shipping season, and adverse weather conditions in early 2014.
• We incurred higher expenses associated with outside contract carriers, due to volume growth, issues associated with
the service performance of rail carriers, and the adverse weather conditions in early 2014.
• These cost increases were partially offset by a reduction in worker's compensation expense, due to actuarial
adjustments that were largely attributable to operational safety and claims management initiatives.
• These cost increases were also mitigated by certain network efficiency and productivity improvements, which resulted
in a 0.4% reduction in the total adjusted cost per piece in 2014 compared with 2013. We have continued to adjust our
air and ground networks to better match higher volume levels, utilize technology to increase package sorting and
delivery efficiency, and benefit from improved pick-up and delivery densities (particularly for our residential
products). These improvements allowed us to process increased volume (up 6.4%) at a faster rate than the increase in
average daily aircraft block hours (up 2.4%) and vehicle miles driven (up 4.2%).
In the fourth quarter of 2014, adjusted operating expenses increased 9.4%, as decreased productivity, higher contract
carrier rates, and additional union overtime and training hours contributed to approximately $200 million in excess costs. In
order to process the significant increase in package volume while maintaining service levels, we increased our overall capacity
through additional staffing, more equipment rentals and new operating facilities. Additionally, we elected to operate on one
additional day during the fourth quarter of 2014 to further improve service levels. However, the significant variability in
package volume during the holiday shipping season resulted in a sub-optimized transportation network, and a reduction in
productivity (average daily union labor hours increased 10.5%, compared with the volume increase of 6.6%). The total
adjusted cost per piece in the fourth quarter of 2014 increased 1.0% compared with the fourth quarter of 2013.