UPS 2014 Annual Report Download - page 58
Download and view the complete annual report
Please find page 58 of the 2014 UPS annual report below. You can navigate through the pages in the report by either clicking on the pages listed below, or by using the keyword search tool below to find specific information within the annual report.-
 1
1 -
2
-
3
-
4
-
5
-
6
-
7
-
8
-
9
-
10
-
11
-
12
-
13
-
14
-
15
-
16
-
17
-
18
-
19
-
20
-
21
-
22
-
23
-
24
-
25
-
26
-
27
-
28
-
29
-
30
-
31
-
32
-
33
-
34
-
35
-
36
-
37
-
38
-
39
-
40
-
41
-
42
-
43
-
44
-
45
-
46
-
47
-
 48
48 -
 49
49 -
 50
50 -
 51
51 -
 52
52 -
 53
53 -
 54
54 -
 55
55 -
 56
56 -
 57
57 -
 58
58 -
 59
59 -
 60
60 -
 61
61 -
 62
62 -
 63
63 -
 64
64 -
 65
65 -
 66
66 -
 67
67 -
 68
68 -
69
-
70
-
71
-
72
-
73
-
74
-
75
-
76
-
77
-
78
-
79
-
80
-
81
-
82
-
83
-
84
-
85
-
86
-
87
-
88
-
89
-
90
-
91
-
92
-
93
-
94
-
95
-
96
-
97
-
98
-
99
-
100
-
101
-
102
-
103
-
104
-
105
-
106
-
107
-
108
-
109
-
110
-
111
-
112
-
113
-
114
-
115
-
116
-
117
-
118
-
119
-
120
-
121
-
122
-
123
-
124
-
125
-
126
-
127
-
128
-
129
-
130
-
131
-
132
-
133
-
134
-
135
-
136
-
137
-
138
-
139
-
140
 |
 |

UNITED PARCEL SERVICE, INC. AND SUBSIDIARIES
MANAGEMENT'S DISCUSSION AND ANALYSIS OF FINANCIAL CONDITION AND
RESULTS OF OPERATIONS
46
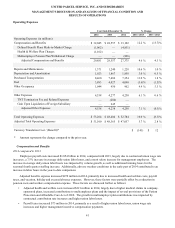
2014 compared to 2013
Our adjusted effective tax rate increased slightly to 35.5% in 2014 from 35.4% in 2013 due to a decrease in U.S. Federal
and state tax credits relative to total pre-tax income, which was largely offset by favorable changes in the proportion of our
taxable income in certain U.S. and non-U.S. jurisdictions relative to total pre-tax income.
2013 compared to 2012
Our adjusted effective tax rate increased to 35.4% in 2013 from 34.5% in 2012, due to a decrease in U.S. Federal and state
tax credits relative to total pre-tax income, and unfavorable changes in the proportion of our taxable income in certain U.S. and
non-U.S. jurisdictions relative to total pre-tax income.
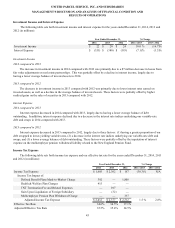
Liquidity and Capital Resources
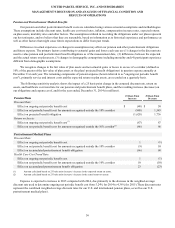
Operating Activities
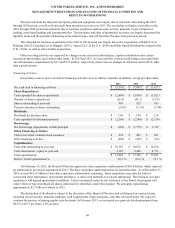
The following is a summary of the significant sources (uses) of cash from operating activities (amounts in millions):
2014 2013 2012
Net income $ 3,032 $ 4,372 $ 807
Non-cash operating activities(a) 5,901 3,318 7,313
Pension and postretirement plan contributions (UPS-sponsored plans) (1,258)(212)(917)
Settlement of postretirement benefit obligation (2,271)——
Income tax receivables and payables (224)(155) 280
Changes in working capital and other noncurrent assets and liabilities 512 121 (148)
Other operating activities 34 (140)(119)
Net cash from operating activities $ 5,726 $ 7,304 $ 7,216
(a) Represents depreciation and amortization, gains and losses on derivative and foreign exchange transactions, deferred
income taxes, provisions for uncollectible accounts, pension and postretirement benefit expense, stock compensation
expense, impairment charges and other non-cash items.
Cash from operating activities remained strong throughout the 2012 to 2014 time period. Operating cash flow was
adversely impacted by $1.527 billion due to certain transactions resulting from the ratification of our collective bargaining
agreement with the Teamsters in 2014. These transactions are discussed further in the "Collective Bargaining Agreements"
section:
• We paid $2.271 billion to settle postretirement benefit obligations for certain union employees.
• We paid $176 million in 2014 for retroactive economic benefits under the collective bargaining agreement that were
related to the period between August through December of 2013.
• During 2014, we received cash tax benefits of $920 million from the items described above (through reduced U.S.
Federal and state quarterly income tax payments).
Most of the remaining variability in operating cash flows during the 2012 to 2014 time period relates to the funding of
our company-sponsored pension and postretirement benefit plans (and related cash tax deductions). Except for discretionary or
accelerated fundings of our plans, contributions to our company-sponsored pension plans have largely varied based on whether
any minimum funding requirements are present for individual pension plans.
• In 2014, we made discretionary contributions to our three primary company-sponsored U.S. pension plans totaling
$1.042 billion.
• In 2013, we did not have any required, nor make any discretionary, contributions to our primary company-sponsored
pension plans in the U.S.
• In 2012, we made a $355 million required contribution to the UPS IBT Pension Plan.
• The remaining contributions in the 2012 through 2014 period were largely due to contributions to our international
pension plans and U.S. postretirement medical benefit plans.