UPS 2014 Annual Report Download - page 61
Download and view the complete annual report
Please find page 61 of the 2014 UPS annual report below. You can navigate through the pages in the report by either clicking on the pages listed below, or by using the keyword search tool below to find specific information within the annual report.-
 1
1 -
2
-
3
-
4
-
5
-
6
-
7
-
8
-
9
-
10
-
11
-
12
-
13
-
14
-
15
-
16
-
17
-
18
-
19
-
20
-
21
-
22
-
23
-
24
-
25
-
26
-
27
-
28
-
29
-
30
-
31
-
32
-
33
-
34
-
35
-
36
-
37
-
38
-
39
-
40
-
41
-
42
-
43
-
44
-
45
-
46
-
47
-
48
-
49
-
50
-
 51
51 -
 52
52 -
 53
53 -
 54
54 -
 55
55 -
 56
56 -
 57
57 -
 58
58 -
 59
59 -
 60
60 -
 61
61 -
 62
62 -
 63
63 -
 64
64 -
 65
65 -
 66
66 -
 67
67 -
 68
68 -
 69
69 -
 70
70 -
 71
71 -
72
-
73
-
74
-
75
-
76
-
77
-
78
-
79
-
80
-
81
-
82
-
83
-
84
-
85
-
86
-
87
-
88
-
89
-
90
-
91
-
92
-
93
-
94
-
95
-
96
-
97
-
98
-
99
-
100
-
101
-
102
-
103
-
104
-
105
-
106
-
107
-
108
-
109
-
110
-
111
-
112
-
113
-
114
-
115
-
116
-
117
-
118
-
119
-
120
-
121
-
122
-
123
-
124
-
125
-
126
-
127
-
128
-
129
-
130
-
131
-
132
-
133
-
134
-
135
-
136
-
137
-
138
-
139
-
140
 |
 |
UNITED PARCEL SERVICE, INC. AND SUBSIDIARIES
MANAGEMENT'S DISCUSSION AND ANALYSIS OF FINANCIAL CONDITION AND
RESULTS OF OPERATIONS
49
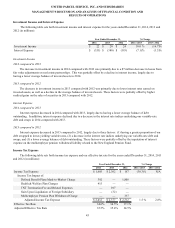
Issuances of debt in 2014 and 2013 consisted primarily of longer-maturity commercial paper. Issuances of debt in 2012
consisted primarily of senior fixed rate note offerings totaling $1.75 billion.
Repayments of debt in 2014 and 2013 consisted primarily of the maturity of our $1.0 and $1.75 billion senior fixed rate
notes that matured in April 2014 and January 2013, respectively. The remaining repayments of debt during the 2012 through
2014 time period included paydowns of commercial paper and scheduled principal payments on our capitalized lease
obligations. We consider the overall fixed and floating interest rate mix of our portfolio and the related overall cost of
borrowing when planning for future issuances and non-scheduled repayments of debt.
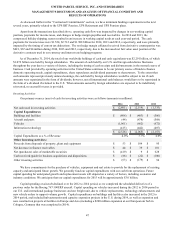
We had $772 million of commercial paper outstanding at December 31, 2014, and no commercial paper outstanding at
December 31, 2013 and 2012. The amount of commercial paper outstanding fluctuates throughout each year based on daily
liquidity needs. The average commercial paper balance was $1.356 billion and the average interest rate paid was 0.10% in 2014
($1.013 billion and 0.07% in 2013, and $962 million and 0.07% in 2012, respectively).
The variation in cash received from common stock issuances to employees was primarily due to level of stock option
exercises in the 2012 through 2014 period.
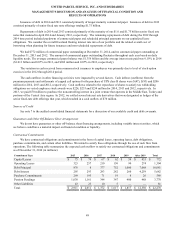
The cash outflows in other financing activities were impacted by several factors. Cash inflows (outflows) from the
premium payments and settlements of capped call options for the purchase of UPS class B shares were $(47), $(93) and $206
million for 2014, 2013 and 2012, respectively. Cash outflows related to the repurchase of shares to satisfy tax withholding
obligations on vested employee stock awards were $224, $253 and $234 million for 2014, 2013 and 2012, respectively. In
2013, we paid $70 million to purchase the noncontrolling interest in a joint venture that operates in the Middle East, Turkey and
portions of the Central Asia region. In 2012, we settled several interest rate derivatives that were designated as hedges of the
senior fixed-rate debt offerings that year, which resulted in a cash outflow of $70 million.
Sources of Credit
See note 7 to the audited consolidated financial statements for a discussion of our available credit and debt covenants.
Guarantees and Other Off-Balance Sheet Arrangements
We do not have guarantees or other off-balance sheet financing arrangements, including variable interest entities, which
we believe could have a material impact on financial condition or liquidity.
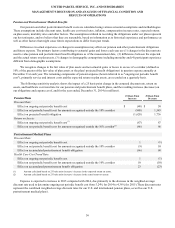
Contractual Commitments
We have contractual obligations and commitments in the form of capital leases, operating leases, debt obligations,
purchase commitments, and certain other liabilities. We intend to satisfy these obligations through the use of cash flow from
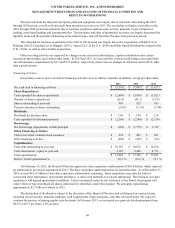
operations. The following table summarizes the expected cash outflow to satisfy our contractual obligations and commitments
as of December 31, 2014 (in millions):
Commitment Type 2015 2016 2017 2018 2019 After 2019 Total
Capital Leases $ 75 $ 74 $ 67 $ 62 $ 59 $ 435 $ 772
Operating Leases 323 257 210 150 90 274 1,304
Debt Principal 876 8 377 752 1,000 7,068 10,081
Debt Interest 295 293 293 282 260 4,259 5,682
Purchase Commitments 269 195 71 19 8 26 588
Pension Fundings 1,030 1,161 344 347 400 488 3,770
Other Liabilities 43 23 10 5 — — 81
Total $ 2,911 $ 2,011 $ 1,372 $ 1,617 $ 1,817 $ 12,550 $ 22,278