UPS 2014 Annual Report Download - page 86
Download and view the complete annual report
Please find page 86 of the 2014 UPS annual report below. You can navigate through the pages in the report by either clicking on the pages listed below, or by using the keyword search tool below to find specific information within the annual report.-
 1
1 -
2
-
3
-
4
-
5
-
6
-
7
-
8
-
9
-
10
-
11
-
12
-
13
-
14
-
15
-
16
-
17
-
18
-
19
-
20
-
21
-
22
-
23
-
24
-
25
-
26
-
27
-
28
-
29
-
30
-
31
-
32
-
33
-
34
-
35
-
36
-
37
-
38
-
39
-
40
-
41
-
42
-
43
-
44
-
45
-
46
-
47
-
48
-
49
-
50
-
51
-
52
-
53
-
54
-
55
-
56
-
57
-
58
-
59
-
60
-
61
-
62
-
63
-
64
-
65
-
66
-
67
-
68
-
69
-
70
-
71
-
72
-
73
-
74
-
75
-
 76
76 -
 77
77 -
 78
78 -
 79
79 -
 80
80 -
 81
81 -
 82
82 -
 83
83 -
 84
84 -
 85
85 -
 86
86 -
 87
87 -
 88
88 -
 89
89 -
 90
90 -
 91
91 -
 92
92 -
 93
93 -
 94
94 -
 95
95 -
 96
96 -
97
-
98
-
99
-
100
-
101
-
102
-
103
-
104
-
105
-
106
-
107
-
108
-
109
-
110
-
111
-
112
-
113
-
114
-
115
-
116
-
117
-
118
-
119
-
120
-
121
-
122
-
123
-
124
-
125
-
126
-
127
-
128
-
129
-
130
-
131
-
132
-
133
-
134
-
135
-
136
-
137
-
138
-
139
-
140
 |
 |

UNITED PARCEL SERVICE, INC. AND SUBSIDIARIES
NOTES TO CONSOLIDATED FINANCIAL STATEMENTS
74
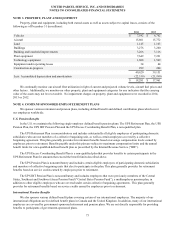
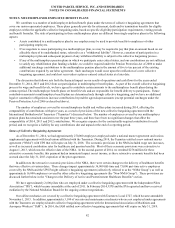
U.S. Postretirement Medical Benefits
We also sponsor postretirement medical plans in the U.S. that provide healthcare benefits to our retirees who meet certain
eligibility requirements and who are not otherwise covered by multiemployer plans. Generally, this includes employees with at
least 10 years of service who have reached age 55 and employees who are eligible for postretirement medical benefits from a
Company-sponsored plan pursuant to collective bargaining agreements. We have the right to modify or terminate certain of
these plans. These benefits have been provided to certain retirees on a noncontributory basis; however, in many cases, retirees
are required to contribute all or a portion of the total cost of the coverage.
Defined Contribution Plans
We also sponsor several defined contribution plans for all employees not covered under collective bargaining agreements,
and for certain employees covered under collective bargaining agreements. The Company matches, in shares of UPS common
stock or cash, a portion of the participating employees’ contributions. Matching contributions charged to expense were $95,
$90 and $83 million for 2014, 2013 and 2012, respectively.
Contributions are also made to defined contribution money purchase plans under certain collective bargaining
agreements. Amounts charged to expense were $82, $80 and $80 million for 2014, 2013 and 2012, respectively.
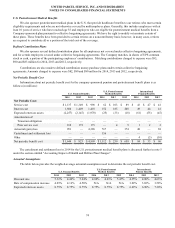
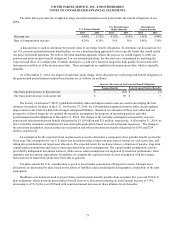
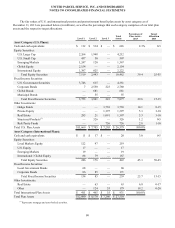
Net Periodic Benefit Cost
Information about net periodic benefit cost for the company-sponsored pension and postretirement benefit plans is as
follows (in millions):
U.S. Pension Benefits
U.S. Postretirement
Medical Benefits
International
Pension Benefits
2014 2013 2012 2014 2013 2012 2014 2013 2012
Net Periodic Cost:
Service cost $ 1,137 $ 1,349 $ 998 $ 62 $ 103 $ 89 $ 43 $ 47 $ 41
Interest cost 1,604 1,449 1,410 152 185 208 49 44 41
Expected return on assets (2,257) (2,147) (1,970)(25)(33)(18)(61)(55)(47)
Amortization of:
Transition obligation — — ———————
Prior service cost 169 172 173 —45122
Actuarial (gain) loss 991 — 4,388 767 — 374 48 — 69
Curtailment and settlement loss — — — 356 — — — — —
Other — — ———— 4(5)(10)
Net periodic benefit cost $ 1,644 $ 823 $ 4,999 $1,312 $ 259 $ 658 $ 84 $ 33 $ 96
The curtailment and settlement loss in 2014 for the U.S. postretirement medical benefit plans is discussed further in note 5
under the section entitled "Accounting Impact of Health and Welfare Plan Changes".
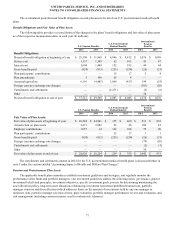
Actuarial Assumptions
The table below provides the weighted-average actuarial assumptions used to determine the net periodic benefit cost.
U.S. Pension Benefits
U.S. Postretirement
Medical Benefits
International
Pension Benefits
2014 2013 2012 2014 2013 2012 2014 2013 2012
Discount rate 5.32% 4.42% 5.64% 4.89% 4.21% 5.47% 4.35% 4.00% 4.63%
Rate of compensation increase 4.29% 4.16% 4.50% N/A N/A N/A 3.22% 3.03% 3.58%
Expected return on assets 8.75% 8.75% 8.75% 8.75% 8.75% 8.75% 6.29% 6.90% 7.20%