UPS 2014 Annual Report Download - page 50
Download and view the complete annual report
Please find page 50 of the 2014 UPS annual report below. You can navigate through the pages in the report by either clicking on the pages listed below, or by using the keyword search tool below to find specific information within the annual report.-
 1
1 -
2
-
3
-
4
-
5
-
6
-
7
-
8
-
9
-
10
-
11
-
12
-
13
-
14
-
15
-
16
-
17
-
18
-
19
-
20
-
21
-
22
-
23
-
24
-
25
-
26
-
27
-
28
-
29
-
30
-
31
-
32
-
33
-
34
-
35
-
36
-
37
-
38
-
39
-
 40
40 -
 41
41 -
 42
42 -
 43
43 -
 44
44 -
 45
45 -
 46
46 -
 47
47 -
 48
48 -
 49
49 -
 50
50 -
 51
51 -
 52
52 -
 53
53 -
 54
54 -
 55
55 -
 56
56 -
 57
57 -
 58
58 -
 59
59 -
 60
60 -
61
-
62
-
63
-
64
-
65
-
66
-
67
-
68
-
69
-
70
-
71
-
72
-
73
-
74
-
75
-
76
-
77
-
78
-
79
-
80
-
81
-
82
-
83
-
84
-
85
-
86
-
87
-
88
-
89
-
90
-
91
-
92
-
93
-
94
-
95
-
96
-
97
-
98
-
99
-
100
-
101
-
102
-
103
-
104
-
105
-
106
-
107
-
108
-
109
-
110
-
111
-
112
-
113
-
114
-
115
-
116
-
117
-
118
-
119
-
120
-
121
-
122
-
123
-
124
-
125
-
126
-
127
-
128
-
129
-
130
-
131
-
132
-
133
-
134
-
135
-
136
-
137
-
138
-
139
-
140
 |
 |

UNITED PARCEL SERVICE, INC. AND SUBSIDIARIES
MANAGEMENT'S DISCUSSION AND ANALYSIS OF FINANCIAL CONDITION AND
RESULTS OF OPERATIONS
38
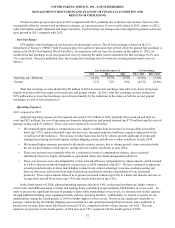
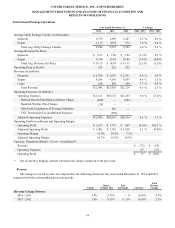
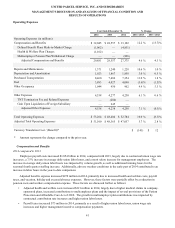
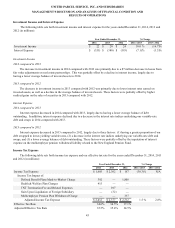
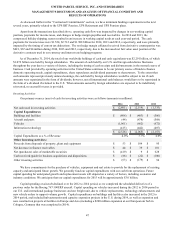
Supply Chain & Freight Operations
Year Ended December 31, % Change
2014 2013 2012 2014 / 2013 2013 / 2012
Freight LTL Statistics:
Revenue (in millions) $ 2,633 $ 2,502 $ 2,377 5.2 % 5.3 %
Revenue Per Hundredweight $ 22.64 $ 22.05 $ 21.73 2.7 % 1.5 %
Shipments (in thousands) 10,762 10,497 10,136 2.5 % 3.6 %
Shipments Per Day (in thousands) 42.5 41.5 40.1 2.5 % 3.6 %
Gross Weight Hauled (in millions of lbs) 11,632 11,348 10,939 2.5 % 3.7 %
Weight Per Shipment (in lbs) 1,081 1,081 1,079 — % 0.2 %
Operating Days in Period 253 253 253
Revenue (in millions):
Forwarding and Logistics $ 5,758 $ 5,492 $ 5,977 4.8 % (8.1)%
Freight 3,048 2,882 2,640 5.8 % 9.2 %
Other 587 561 530 4.6 % 5.8 %
Total Revenue $ 9,393 $ 8,935 $ 9,147 5.1 % (2.3)%
Operating Expenses (in millions):
Operating Expenses $ 8,961 $ 8,261 $ 9,132 8.5 % (9.5)%
Defined Benefit Plans Mark-to-Market Charge (202)—
(713)
Health & Welfare Plan Charges (84)— —
Adjusted Operating Expenses $ 8,675 $ 8,261 $ 8,419 5.0 % (1.9)%
Operating Profit (in millions) and Operating Margins:
Operating Profit $ 432 $ 674 $ 15 (35.9)% N/A
Adjusted Operating Profit $ 718 $ 674 $ 728 6.5 % (7.4)%
Operating Margin 4.6% 7.5% 0.2%
Adjusted Operating Margin 7.6% 7.5% 8.0%
Currency Translation Benefit / (Cost)—(in millions)*:
Revenue $ (65) $ (31)
Operating Expenses 54 25
Operating Profit $ (11) $ (6)
* Amount represents the change compared to the prior year.
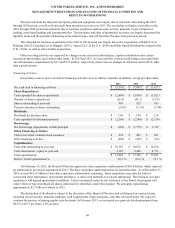
Revenue
2014 compared to 2013
Forwarding and logistics revenue increased $266 million in 2014 compared with 2013. Forwarding revenue increased for
the year, primarily due to volume and tonnage growth in our international air freight, North American air freight and ocean
freight businesses, which were impacted by improving overall market demand. This was partially offset, however, by lower
rates charged to our customers in our international air forwarding business, which was largely due to industry overcapacity in
key trade lanes, particularly the Asia-outbound market. Revenue for our logistics products increased in 2014, as we
experienced solid growth in our mail services, healthcare and retail distribution solutions.