UPS 2014 Annual Report Download - page 123
Download and view the complete annual report
Please find page 123 of the 2014 UPS annual report below. You can navigate through the pages in the report by either clicking on the pages listed below, or by using the keyword search tool below to find specific information within the annual report.-
 1
1 -
2
-
3
-
4
-
5
-
6
-
7
-
8
-
9
-
10
-
11
-
12
-
13
-
14
-
15
-
16
-
17
-
18
-
19
-
20
-
21
-
22
-
23
-
24
-
25
-
26
-
27
-
28
-
29
-
30
-
31
-
32
-
33
-
34
-
35
-
36
-
37
-
38
-
39
-
40
-
41
-
42
-
43
-
44
-
45
-
46
-
47
-
48
-
49
-
50
-
51
-
52
-
53
-
54
-
55
-
56
-
57
-
58
-
59
-
60
-
61
-
62
-
63
-
64
-
65
-
66
-
67
-
68
-
69
-
70
-
71
-
72
-
73
-
74
-
75
-
76
-
77
-
78
-
79
-
80
-
81
-
82
-
83
-
84
-
85
-
86
-
87
-
88
-
89
-
90
-
91
-
92
-
93
-
94
-
95
-
96
-
97
-
98
-
99
-
100
-
101
-
102
-
103
-
104
-
105
-
106
-
107
-
108
-
109
-
110
-
111
-
112
-
 113
113 -
 114
114 -
 115
115 -
 116
116 -
 117
117 -
 118
118 -
 119
119 -
 120
120 -
 121
121 -
 122
122 -
 123
123 -
 124
124 -
 125
125 -
 126
126 -
 127
127 -
 128
128 -
 129
129 -
 130
130 -
 131
131 -
 132
132 -
 133
133 -
134
-
135
-
136
-
137
-
138
-
139
-
140
 |
 |

UNITED PARCEL SERVICE, INC. AND SUBSIDIARIES
NOTES TO CONSOLIDATED FINANCIAL STATEMENTS
111
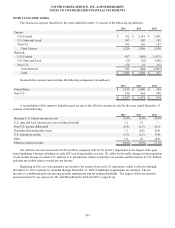
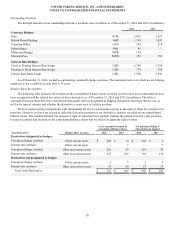
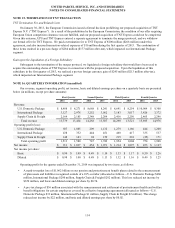
Outstanding Positions
The notional amounts of our outstanding derivative positions were as follows as of December 31, 2014 and 2013 (in millions):
2014 2013
Currency Hedges:
Euro EUR 2,833 2,637
British Pound Sterling GBP 1,149 1,097
Canadian Dollar CAD 293 218
Indian Rupee INR 85 —
Malaysian Ringgit MYR 150 —
Mexican Peso MXN 152 583
Interest Rate Hedges:
Fixed to Floating Interest Rate Swaps USD 5,799 6,799
Floating to Fixed Interest Rate Swaps USD 779 780
Interest Rate Basis Swaps USD 1,500 2,500
As of December 31, 2014, we had no outstanding commodity hedge positions. The maximum term over which we are hedging
exposures to the variability of cash flow is 35 years.
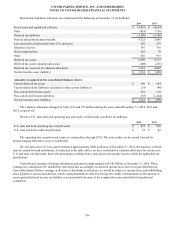
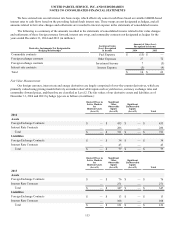
Balance Sheet Recognition
The following table indicates the location on the consolidated balance sheets in which our derivative assets and liabilities have
been recognized, and the related fair values of those derivatives as of December 31, 2014 and 2013 (in millions). The table is
segregated between those derivative instruments that qualify and are designated as hedging instruments and those that are not, as
well as by type of contract and whether the derivative is in an asset or liability position.
We have master netting arrangements with substantially all of our counterparties giving us the right of offset for our derivative
positions. However, we have not elected to offset the fair value positions of our derivative contracts recorded on our consolidated
balance sheets. The columns labeled "net amounts if right of offset had been applied" indicate the potential net fair value positions
by type of contract and location on the consolidated balance sheets had we elected to apply the right of offset.
Gross Amounts Presented in
Consolidated Balance Sheets
Net Amounts if Right of
Offset had been Applied
Asset Derivatives Balance Sheet Location 2014 2013 2014 2013
Derivatives designated as hedges:
Foreign exchange contracts Other current assets $ 204 $ 10 $ 204 $ 4
Interest rate contracts Other current assets — 7 — 7
Foreign exchange contracts Other non-current assets 229 59 229 59
Interest rate contracts Other non-current assets 227 204 194 110
Derivatives not designated as hedges:
Foreign exchange contracts Other current assets 2725
Interest rate contracts Other non-current assets 59 60 57 57
Total Asset Derivatives $ 721 $ 347 $ 686 $ 242