UPS 2014 Annual Report Download - page 83
Download and view the complete annual report
Please find page 83 of the 2014 UPS annual report below. You can navigate through the pages in the report by either clicking on the pages listed below, or by using the keyword search tool below to find specific information within the annual report.-
 1
1 -
2
-
3
-
4
-
5
-
6
-
7
-
8
-
9
-
10
-
11
-
12
-
13
-
14
-
15
-
16
-
17
-
18
-
19
-
20
-
21
-
22
-
23
-
24
-
25
-
26
-
27
-
28
-
29
-
30
-
31
-
32
-
33
-
34
-
35
-
36
-
37
-
38
-
39
-
40
-
41
-
42
-
43
-
44
-
45
-
46
-
47
-
48
-
49
-
50
-
51
-
52
-
53
-
54
-
55
-
56
-
57
-
58
-
59
-
60
-
61
-
62
-
63
-
64
-
65
-
66
-
67
-
68
-
69
-
70
-
71
-
72
-
 73
73 -
 74
74 -
 75
75 -
 76
76 -
 77
77 -
 78
78 -
 79
79 -
 80
80 -
 81
81 -
 82
82 -
 83
83 -
 84
84 -
 85
85 -
 86
86 -
 87
87 -
 88
88 -
 89
89 -
 90
90 -
 91
91 -
 92
92 -
 93
93 -
94
-
95
-
96
-
97
-
98
-
99
-
100
-
101
-
102
-
103
-
104
-
105
-
106
-
107
-
108
-
109
-
110
-
111
-
112
-
113
-
114
-
115
-
116
-
117
-
118
-
119
-
120
-
121
-
122
-
123
-
124
-
125
-
126
-
127
-
128
-
129
-
130
-
131
-
132
-
133
-
134
-
135
-
136
-
137
-
138
-
139
-
140
 |
 |

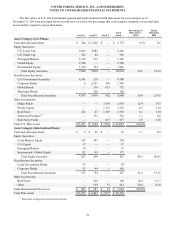
UNITED PARCEL SERVICE, INC. AND SUBSIDIARIES
NOTES TO CONSOLIDATED FINANCIAL STATEMENTS
71
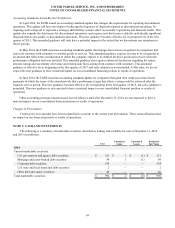
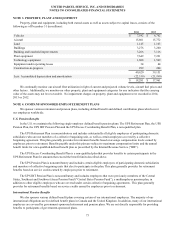
Maturity Information
The amortized cost and estimated fair value of marketable securities at December 31, 2014, by contractual maturity, are
shown below (in millions). Actual maturities may differ from contractual maturities because the issuers of the securities may
have the right to prepay obligations without prepayment penalties.
Cost
Estimated
Fair Value
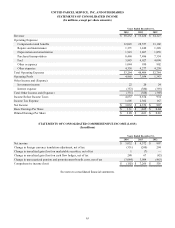
Due in one year or less $ 459 $ 459
Due after one year through three years 439 439
Due after three years through five years 15 15
Due after five years 77 77
990 990
Equity securities 22
$ 992 $ 992
Non-Current Investments and Restricted Cash
Restricted cash is primarily associated with our self-insurance requirements. We entered into an escrow agreement with
an insurance carrier to guarantee our self-insurance obligations. This agreement requires us to provide cash collateral to the
insurance carrier, which is invested in money market funds and similar cash equivalent type assets. Additional cash collateral
provided is reflected in "other investing activities" in the statements of consolidated cash flows. As of December 31, 2014 and
2013, we had $442 and $425 million in self-insurance restricted cash, respectively.
We held a $19 million investment in a variable life insurance policy to fund benefits for the UPS Excess Coordinating
Benefit Plan at both December 31, 2014 and 2013. The quarterly change in investment fair value is recognized in "investment
income" on the statements of consolidated income. Additionally, we held escrowed cash related to the acquisition and
disposition of certain assets, primarily real estate, of $28 million as of December 31, 2014 (none as of December 31, 2013).
The amounts described above are classified as “investments and restricted cash” in the consolidated balance sheets.
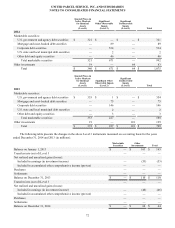
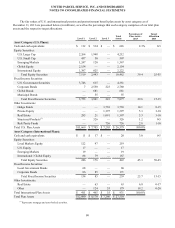
Fair Value Measurements
Marketable securities utilizing Level 1 inputs include active exchange-traded equity securities and equity index funds,
and most U.S. Government debt securities, as these securities all have quoted prices in active markets. Marketable securities
utilizing Level 2 inputs include asset-backed securities, corporate bonds and municipal bonds. These securities are valued using
market corroborated pricing, matrix pricing or other models that utilize observable inputs such as yield curves.
We maintain holdings in certain investment partnerships that are measured at fair value utilizing Level 3 inputs (classified
as “other investments” in the tables below, and as “other non-current assets” in the consolidated balance sheets). These
partnership holdings do not have quoted prices, nor can they be valued using inputs based on observable market data. These
investments are valued internally using a discounted cash flow model with two significant inputs: (1) the after-tax cash flow
projections for each partnership, and (2) a risk-adjusted discount rate consistent with the duration of the expected cash flows for
each partnership. The weighted-average discount rates used to value these investments were 7.81% and 8.65% as of
December 31, 2014 and 2013, respectively. These inputs and the resulting fair values are updated on a quarterly basis.
The following table presents information about our investments measured at fair value on a recurring basis as of
December 31, 2014 and 2013, and indicates the fair value hierarchy of the valuation techniques utilized to determine such fair
value (in millions):