UPS 2014 Annual Report Download - page 5
Download and view the complete annual report
Please find page 5 of the 2014 UPS annual report below. You can navigate through the pages in the report by either clicking on the pages listed below, or by using the keyword search tool below to find specific information within the annual report.-
 1
1 -
 2
2 -
 3
3 -
 4
4 -
 5
5 -
 6
6 -
 7
7 -
 8
8 -
 9
9 -
 10
10 -
 11
11 -
 12
12 -
 13
13 -
 14
14 -
 15
15 -
 16
16 -
17
-
18
-
19
-
20
-
21
-
22
-
23
-
24
-
25
-
26
-
27
-
28
-
29
-
30
-
31
-
32
-
33
-
34
-
35
-
36
-
37
-
38
-
39
-
40
-
41
-
42
-
43
-
44
-
45
-
46
-
47
-
48
-
49
-
50
-
51
-
52
-
53
-
54
-
55
-
56
-
57
-
58
-
59
-
60
-
61
-
62
-
63
-
64
-
65
-
66
-
67
-
68
-
69
-
70
-
71
-
72
-
73
-
74
-
75
-
76
-
77
-
78
-
79
-
80
-
81
-
82
-
83
-
84
-
85
-
86
-
87
-
88
-
89
-
90
-
91
-
92
-
93
-
94
-
95
-
96
-
97
-
98
-
99
-
100
-
101
-
102
-
103
-
104
-
105
-
106
-
107
-
108
-
109
-
110
-
111
-
112
-
113
-
114
-
115
-
116
-
117
-
118
-
119
-
120
-
121
-
122
-
123
-
124
-
125
-
126
-
127
-
128
-
129
-
130
-
131
-
132
-
133
-
134
-
135
-
136
-
137
-
138
-
139
-
140
 |
 |

Globally,
e-commerce
is expected to grow
at four times the rate
of Gross Domestic
Product.
5
• Further expanding our network and capabilities in
growth markets around the world. We’ve identified and
are implementing strategies in 13 key emerging and growth
markets that present the most opportunity. For instance, in
2015, UPS will begin expanding in 20 new markets across
China, while deepening our presence in the 33 markets
we currently serve today. In addition, we’re adding more
premium services and expanding our focus on key industries
as well as large Asian multinational companies.
• Focusing on fast-growing industries such as healthcare
and e-commerce. Since 2011, we’ve nearly doubled
our healthcare footprint, to 7 million square feet. On the
e-commerce front, we continue to expand the size of our
UPS Access PointTM network, and by the end of 2015 will
have more than 20,000 remote locations where consumers
can pick up packages on their own schedule.
• Reengineering processes and interfaces to generate
greater customer satisfaction. We have more than 20
internal optimization projects underway to streamline our
inside operations, control costs and improve customer
service levels.
We believe these initiatives will enable us to accelerate
growth and generate higher returns. In fact, we’re confident in
our ability to continue to generate returns on invested capital*
in excess of 25 percent.
Fortunately, we are starting from a position of relative strength.
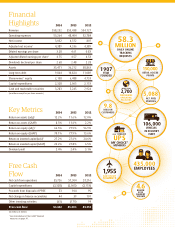
Our free cash flow1 generation remained robust in 2014 at
$3.4 billion, even after making after-tax contributions of
$800 million to company-sponsored pension plans, as well as
$1.5 billion to transfer certain union employees to
multiemployer healthcare plans.
Our robust cash flow enabled UPS to pay dividends of $2.4
billion, an increase of 8 percent per share over the prior year.
Since going public, our efficient use of capital has enabled us
to return $50 billion to shareowners. I expect that we’ll return
more than $30 billion to shareowners over the next five years.
The good news going forward is the global economy is
expected to be modestly stronger in 2015. While parts
of Europe and Asia are expecting slower growth, the U.S.
economy continues to gain momentum. In addition, UPS is
well-positioned to benefit from trends in global economic
activity: e-commerce is expected to grow at four times the
rate of global GDP, and cross-border e-commerce should grow
at seven times that of the global economy.
Of course, we anticipated these trends and have invested not
only in the fastest-growing economies, but in industries like
healthcare and retail that should drive profitable growth for
years to come. I am confident our growth initiatives, along
with our capacity expansion projects and operation technology
implementations, will yield benefits for shareowners.
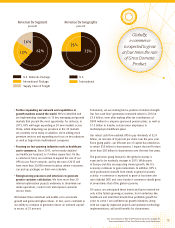
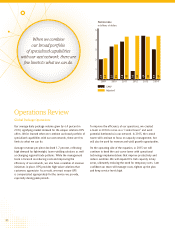
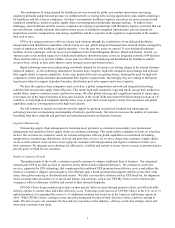
62%
22%
16%
Revenue by Segment
percent
75%
25%
Revenue by Geography
percent
U.S.
International
U.S. Domestic Package
International Package
Supply Chain & Freight
* See reconciliation of Non-GAAP financial measures on page A1.
1 See reconciliation of Free Cash Flow on the inside front cover.