UPS 2014 Annual Report Download - page 51
Download and view the complete annual report
Please find page 51 of the 2014 UPS annual report below. You can navigate through the pages in the report by either clicking on the pages listed below, or by using the keyword search tool below to find specific information within the annual report.-
 1
1 -
2
-
3
-
4
-
5
-
6
-
7
-
8
-
9
-
10
-
11
-
12
-
13
-
14
-
15
-
16
-
17
-
18
-
19
-
20
-
21
-
22
-
23
-
24
-
25
-
26
-
27
-
28
-
29
-
30
-
31
-
32
-
33
-
34
-
35
-
36
-
37
-
38
-
39
-
40
-
 41
41 -
 42
42 -
 43
43 -
 44
44 -
 45
45 -
 46
46 -
 47
47 -
 48
48 -
 49
49 -
 50
50 -
 51
51 -
 52
52 -
 53
53 -
 54
54 -
 55
55 -
 56
56 -
 57
57 -
 58
58 -
 59
59 -
 60
60 -
 61
61 -
62
-
63
-
64
-
65
-
66
-
67
-
68
-
69
-
70
-
71
-
72
-
73
-
74
-
75
-
76
-
77
-
78
-
79
-
80
-
81
-
82
-
83
-
84
-
85
-
86
-
87
-
88
-
89
-
90
-
91
-
92
-
93
-
94
-
95
-
96
-
97
-
98
-
99
-
100
-
101
-
102
-
103
-
104
-
105
-
106
-
107
-
108
-
109
-
110
-
111
-
112
-
113
-
114
-
115
-
116
-
117
-
118
-
119
-
120
-
121
-
122
-
123
-
124
-
125
-
126
-
127
-
128
-
129
-
130
-
131
-
132
-
133
-
134
-
135
-
136
-
137
-
138
-
139
-
140
 |
 |
UNITED PARCEL SERVICE, INC. AND SUBSIDIARIES
MANAGEMENT'S DISCUSSION AND ANALYSIS OF FINANCIAL CONDITION AND
RESULTS OF OPERATIONS
39
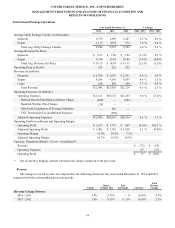
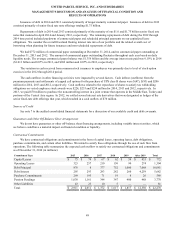
Freight revenue increased $166 million in 2014, driven by solid increases in average daily LTL shipments and LTL
revenue per hundredweight. The increase in average daily LTL shipments in 2014 was impacted by overall U.S. economic
growth and improving LTL market conditions. The increase in LTL revenue per hundredweight was largely due to our focus on
yield management, as well as general rate increases averaging 4.4% and 5.9% that took effect in March 2014 and June 2013,
respectively, covering non-contractual shipments in the United States, Canada and Mexico. LTL fuel surcharge revenue
increased by $13 million in 2014 compared with 2013, due to changes in diesel fuel prices and overall LTL shipment volume.
Revenue for the other businesses within Supply Chain & Freight increased $26 million in 2014, due to revenue growth at
The UPS Store, UPS Capital and UPS Customer Solutions; however, this was partially offset by a decline in revenue from our
contract to provide domestic air transportation services for the U.S. Postal Service.
2013 compared to 2012
Forwarding and logistics revenue decreased $485 million in 2013 compared with 2012. Forwarding revenue decreased in
2013, primarily due to lower tonnage and rates charged to our customers in our international air forwarding business. The
reduction in tonnage was caused by several factors, including weak overall market demand, competitive pressures, and our
customer concentration among the technology and military sectors, as demand in these sectors was relatively weaker than the
remainder of the air freight market. The reduction in rates was largely due to industry overcapacity in key trade lanes,
particularly the Asia-outbound market. Revenue for our logistics products increased in 2013 compared with 2012, as we
experienced solid growth in our mail services and healthcare distribution solutions; however, this was largely offset by revenue
declines among our technology customers.
Freight revenue increased $242 million in 2013, driven by an increase in LTL revenue per hundredweight, tonnage and
average daily LTL shipments. The increase in LTL revenue per hundredweight was largely due to our focus on yield
management, as well as general rate increases averaging 5.9% that took effect on both July 16, 2012 and on June 10, 2013,
covering non-contractual shipments in the United States, Canada and Mexico. LTL fuel surcharge revenue increased by $18
million in 2013 compared with the prior year, due to changes in diesel fuel prices and overall LTL shipment volume. In
addition, our Truckload division experienced increased volume and revenue, primarily related to our dedicated and non-
dedicated service offerings.
The other businesses within Supply Chain & Freight increased revenue by $31 million in 2013, primarily due to growth at
UPS Capital, The UPS Store and UPS Customer Solutions.
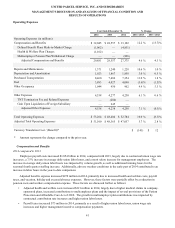
Operating Expenses
2014 compared to 2013
Forwarding and logistics adjusted operating expenses increased $266 million in 2014, largely due to higher purchased
transportation and employee compensation expenses. Purchased transportation expense increased by $229 million for the year,
primarily due to higher volume and tonnage in our international air freight forwarding business and higher rates charged to us
by third-party transportation carriers. Compensation and benefits expense increased $47 million in 2014, due to merit salary
and wage increases for management and hourly employees, along with an increase in the overall size of the workforce.
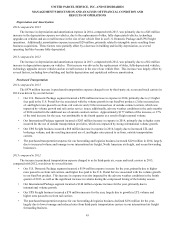
Freight adjusted operating expenses increased $140 million in 2014, while the total adjusted cost per LTL shipment
increased 2.0%. The increase in adjusted operating expenses was largely due to pick-up and delivery expenses (which
increased $96 million) and the costs associated with operating our linehaul network (which increased $65 million). The
increases in pick-up and delivery and network costs were primarily due to contractual wage increases, higher LTL volume and
increased costs associated with outside contract and rail carriers. Partially offsetting these cost increases were reductions in
indirect operating expenses, including lower auto liability and worker's compensation costs, which were impacted by
operational safety and claims management initiatives, as well as lower pension expense.
Operating expenses for the other businesses within Supply Chain & Freight increased $8 million in 2014 compared with
2013.