UPS 2014 Annual Report Download - page 100
Download and view the complete annual report
Please find page 100 of the 2014 UPS annual report below. You can navigate through the pages in the report by either clicking on the pages listed below, or by using the keyword search tool below to find specific information within the annual report.-
 1
1 -
2
-
3
-
4
-
5
-
6
-
7
-
8
-
9
-
10
-
11
-
12
-
13
-
14
-
15
-
16
-
17
-
18
-
19
-
20
-
21
-
22
-
23
-
24
-
25
-
26
-
27
-
28
-
29
-
30
-
31
-
32
-
33
-
34
-
35
-
36
-
37
-
38
-
39
-
40
-
41
-
42
-
43
-
44
-
45
-
46
-
47
-
48
-
49
-
50
-
51
-
52
-
53
-
54
-
55
-
56
-
57
-
58
-
59
-
60
-
61
-
62
-
63
-
64
-
65
-
66
-
67
-
68
-
69
-
70
-
71
-
72
-
73
-
74
-
75
-
76
-
77
-
78
-
79
-
80
-
81
-
82
-
83
-
84
-
85
-
86
-
87
-
88
-
89
-
 90
90 -
 91
91 -
 92
92 -
 93
93 -
 94
94 -
 95
95 -
 96
96 -
 97
97 -
 98
98 -
 99
99 -
 100
100 -
 101
101 -
 102
102 -
 103
103 -
 104
104 -
 105
105 -
 106
106 -
 107
107 -
 108
108 -
 109
109 -
 110
110 -
111
-
112
-
113
-
114
-
115
-
116
-
117
-
118
-
119
-
120
-
121
-
122
-
123
-
124
-
125
-
126
-
127
-
128
-
129
-
130
-
131
-
132
-
133
-
134
-
135
-
136
-
137
-
138
-
139
-
140
 |
 |

UNITED PARCEL SERVICE, INC. AND SUBSIDIARIES
NOTES TO CONSOLIDATED FINANCIAL STATEMENTS
88
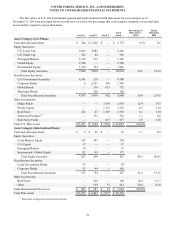
In 2014, we utilized the two-step process to test goodwill for impairment for all of our reporting units. We did not have
any goodwill impairment charges in 2014, 2013 or 2012. Cumulatively, our Supply Chain & Freight reporting segment has
recorded goodwill impairment charges of $622 million, while our International and U.S. Domestic Package segments have not
recorded any impairment charges.
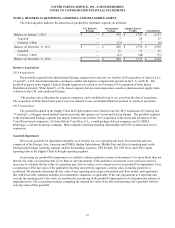
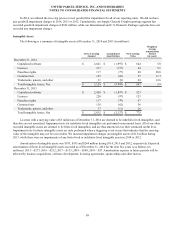
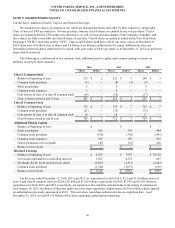
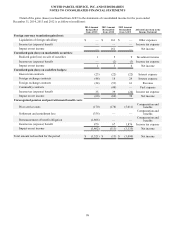
Intangible Assets
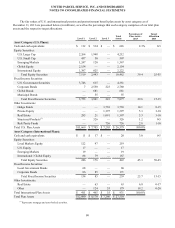
The following is a summary of intangible assets at December 31, 2014 and 2013 (in millions):
Gross Carrying
Amount
Accumulated
Amortization
Net Carrying
Value
Weighted-
Average
Amortization
Period
(in years)
December 31, 2014
Capitalized software $ 2,641 $ (1,997) $ 644 5.0
Licenses 217 (133) 84 5.1
Franchise rights 117 (77) 40 20.0
Customer lists 123 (66) 57 11.7
Trademarks, patents, and other 31 (9) 22 12.6
Total Intangible Assets, Net $ 3,129 $ (2,282) $ 847 5.9
December 31, 2013
Capitalized software $ 2,420 $ (1,897) $ 523
Licenses 220 (97) 123
Franchise rights 117 (70)47
Customer lists 118 (62)56
Trademarks, patents, and other 37 (11)26
Total Intangible Assets, Net $ 2,912 $ (2,137) $ 775
Licenses with a carrying value of $5 million as of December 31, 2014 are deemed to be indefinite-lived intangibles, and
therefore are not amortized. Impairment tests for indefinite-lived intangibles are performed on an annual basis. All of our other
recorded intangible assets are deemed to be finite-lived intangibles, and are thus amortized over their estimated useful lives.
Impairment tests for these intangible assets are only performed when a triggering event occurs that indicates that the carrying
value of the intangible may not be recoverable. We incurred impairment charges on intangible assets of $13 million during
2013, while there were no impairments of any finite-lived or indefinite-lived intangible assets in 2014 or 2012.
Amortization of intangible assets was $195, $185 and $244 million during 2014, 2013 and 2012, respectively. Expected
amortization of finite-lived intangible assets recorded as of December 31, 2014 for the next five years is as follows (in
millions): 2015—$277; 2016—$212; 2017—$153; 2018—$100; 2019—$57. Amortization expense in future periods will be
affected by business acquisitions, software development, licensing agreements, sponsorships and other factors.