UPS 2014 Annual Report Download - page 2
Download and view the complete annual report
Please find page 2 of the 2014 UPS annual report below. You can navigate through the pages in the report by either clicking on the pages listed below, or by using the keyword search tool below to find specific information within the annual report.-
 1
1 -
 2
2 -
 3
3 -
 4
4 -
 5
5 -
 6
6 -
 7
7 -
 8
8 -
 9
9 -
 10
10 -
 11
11 -
 12
12 -
 13
13 -
14
-
15
-
16
-
17
-
18
-
19
-
20
-
21
-
22
-
23
-
24
-
25
-
26
-
27
-
28
-
29
-
30
-
31
-
32
-
33
-
34
-
35
-
36
-
37
-
38
-
39
-
40
-
41
-
42
-
43
-
44
-
45
-
46
-
47
-
48
-
49
-
50
-
51
-
52
-
53
-
54
-
55
-
56
-
57
-
58
-
59
-
60
-
61
-
62
-
63
-
64
-
65
-
66
-
67
-
68
-
69
-
70
-
71
-
72
-
73
-
74
-
75
-
76
-
77
-
78
-
79
-
80
-
81
-
82
-
83
-
84
-
85
-
86
-
87
-
88
-
89
-
90
-
91
-
92
-
93
-
94
-
95
-
96
-
97
-
98
-
99
-
100
-
101
-
102
-
103
-
104
-
105
-
106
-
107
-
108
-
109
-
110
-
111
-
112
-
113
-
114
-
115
-
116
-
117
-
118
-
119
-
120
-
121
-
122
-
123
-
124
-
125
-
126
-
127
-
128
-
129
-
130
-
131
-
132
-
133
-
134
-
135
-
136
-
137
-
138
-
139
-
140
 |
 |
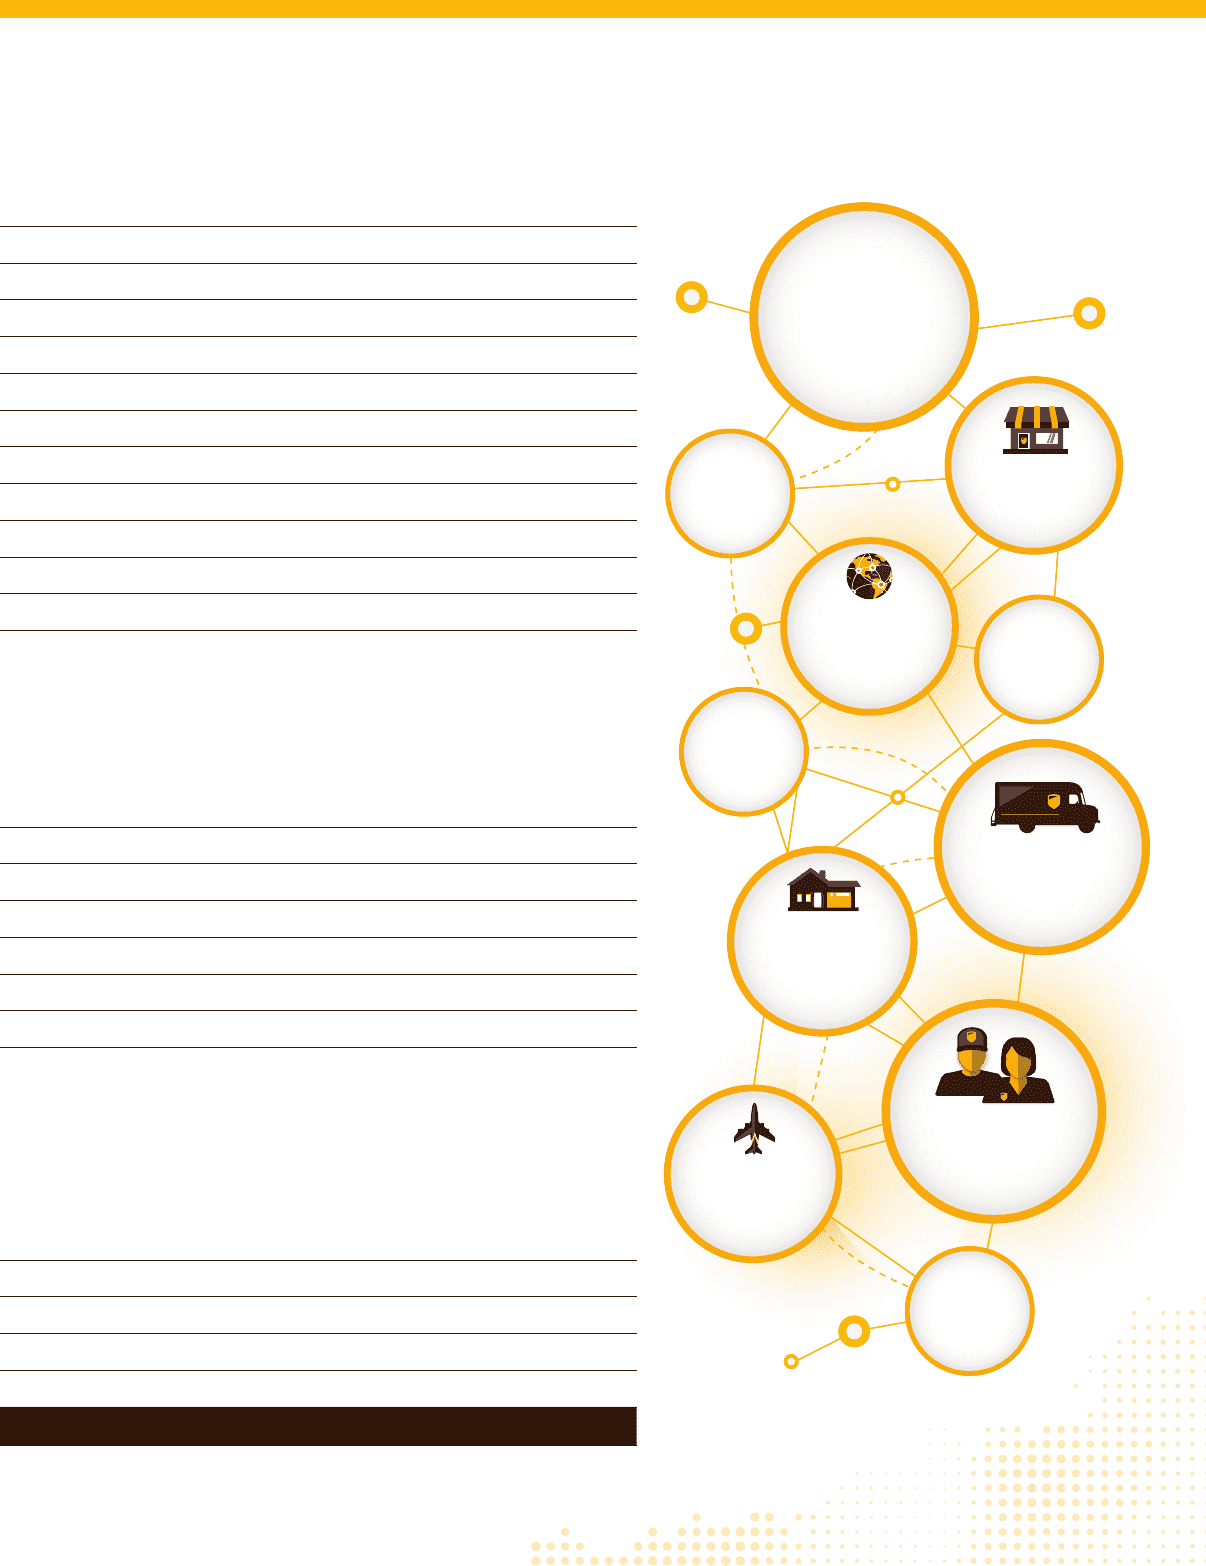
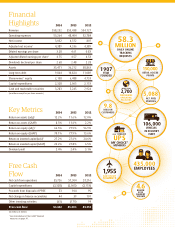
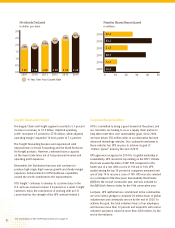
1907
YEAR
FOUNDED
106,000
VEHICLES
IN DELIVERY
FLEET
58.3
MILLION
DAILY ONLINE
TRACKING
REQUESTS
9.8
MILLION
CUSTOMERS
MORE THAN
2,700
WORLDWIDE
OPERATING
FACILITIES
150,000
RETAIL ACCESS
POINTS
4. 6
BILLION
2014
DELIVERY
VOLUME
DAILY FLIGHT
SEGMENTS
1,955
5,088
ALT. FUEL
VEHICLES
UPS
MY CHOICE®
MEMBERS
over 13 MILLION
435,000
EMPLOYEES
Financial
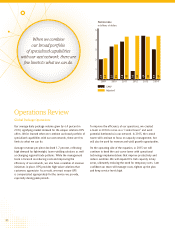
Highlights 2014 2013 2012
Revenue $58,232 $55,438 $54,127
Operating expenses 53,264 48,404 52,784
Net income 3,032 4,372 807
Adjusted net income14,389 4,336 4,389
Diluted earnings per share 3.28 4.61 0.83
Adjusted diluted earnings per share14.75 4.57 4.53
Dividends declared per share 2.68 2.48 2.28
Assets 35,471 36,212 38,863
Long-term debt 9,864 10,824 11,089
Shareowners’ equity 2,158 6,488 4,733
Capital expenditures 2,328 2,065 2,153
Cash and marketable securities 3,283 5,245 7,924
(in millions except for per-share amounts)
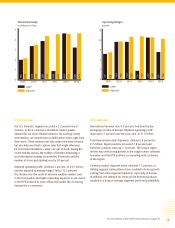
Key Metrics 2014 2013 2012
Return on assets (adj.)112.2% 11.6% 12.0%
Return on assets (GAAP) 8.5% 11.6% 2.2%
Return on equity (adj.)166.5% 77.5% 56.9%
Return on equity (GAAP) 70.1% 77.9% 13.6%
Return on invested capital (adj.)127.2% 27.6% 24.6%
Return on invested capital (GAAP) 22.2% 27.8% 6.5%
Dividend yield 2.4% 2.4% 3.1%
Free Cash
Flow 2014 2013 2012
Net cash from operations $5,726 $7,304 $7,216
Capital expenditures (2,328) (2,065) (2,153)
Proceeds from disposals of PP&E 53 104 95
Net change in finance receivables 44 39 101
Other investing activities (63) (179) 94
Free cash ow $3,432 $5,203 $5,353
(in millions of dollars)
1 See reconciliation of Non-GAAP financial
measures on page A1.