UPS 2014 Annual Report Download - page 37
Download and view the complete annual report
Please find page 37 of the 2014 UPS annual report below. You can navigate through the pages in the report by either clicking on the pages listed below, or by using the keyword search tool below to find specific information within the annual report.-
 1
1 -
2
-
3
-
4
-
5
-
6
-
7
-
8
-
9
-
10
-
11
-
12
-
13
-
14
-
15
-
16
-
17
-
18
-
19
-
20
-
21
-
22
-
23
-
24
-
25
-
26
-
 27
27 -
 28
28 -
 29
29 -
 30
30 -
 31
31 -
 32
32 -
 33
33 -
 34
34 -
 35
35 -
 36
36 -
 37
37 -
 38
38 -
 39
39 -
 40
40 -
 41
41 -
 42
42 -
 43
43 -
 44
44 -
 45
45 -
 46
46 -
 47
47 -
48
-
49
-
50
-
51
-
52
-
53
-
54
-
55
-
56
-
57
-
58
-
59
-
60
-
61
-
62
-
63
-
64
-
65
-
66
-
67
-
68
-
69
-
70
-
71
-
72
-
73
-
74
-
75
-
76
-
77
-
78
-
79
-
80
-
81
-
82
-
83
-
84
-
85
-
86
-
87
-
88
-
89
-
90
-
91
-
92
-
93
-
94
-
95
-
96
-
97
-
98
-
99
-
100
-
101
-
102
-
103
-
104
-
105
-
106
-
107
-
108
-
109
-
110
-
111
-
112
-
113
-
114
-
115
-
116
-
117
-
118
-
119
-
120
-
121
-
122
-
123
-
124
-
125
-
126
-
127
-
128
-
129
-
130
-
131
-
132
-
133
-
134
-
135
-
136
-
137
-
138
-
139
-
140
 |
 |

25
Item 7. Management’s Discussion and Analysis of Financial Condition and Results of Operations
Overview
U.S. economic growth, retail sales and industrial production continued at a moderate pace in 2014, which resulted in
growth in the small package delivery market. Continued strong growth in e-commerce and omni-channel retail sales has driven
package volume increases in both commercial and residential products. Given these trends, overall volume growth was strong
during the year, and products most aligned with business-to-consumer and retail industry shipments experienced the fastest
growth.
Economic conditions in Europe have deteriorated somewhat, as solid growth in the United Kingdom is being offset by
slower growth in Germany and general economic weakness in France and Italy. Economic growth in Asia has continued,
though growth in China has moderated. The uneven nature of economic growth worldwide, combined with a trend towards
more intra-regional trade, has led to shifting trade patterns and resulted in overcapacity in certain trade lanes. These factors
have created an environment in which customers are more likely to trade-down from premium express products to standard
delivery products in both Europe and Asia. As a result of these circumstances, we have adjusted our air capacity and cost
structure in our transportation network to better match the prevailing volume mix levels. Our broad portfolio of product
offerings and the flexibilities inherent in our transportation network have helped us adapt to these changing trends.
While the worldwide economic environment has remained challenging in 2014, we have continued to undertake several
initiatives in the U.S. and internationally to (1) improve the flexibility and capacity in our delivery network; (2) improve yield
management; and (3) increase operational efficiency and contain costs across all segments. Most notably, the continued
deployment of technology improvements (including several facility automation projects and the accelerated deployment of our
On Road Integrated Optimization and Navigation system - "ORION") should increase our network capacity, and improve
operational efficiency, flexibility and reliability. Additionally, we have continued to adjust our transportation network and
utilize new or expanded operating facilities to improve time-in-transit for shipments in each region.
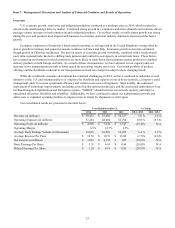
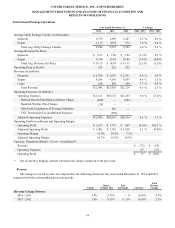
Our consolidated results are presented in the table below:
Year Ended December 31, % Change
2014 2013 2012 2014 / 2013 2013 / 2012
Revenue (in millions) $ 58,232 $ 55,438 $ 54,127 5.0 % 2.4 %
Operating Expenses (in millions) 53,264 48,404 52,784 10.0 % (8.3)%
Operating Profit (in millions) $ 4,968 $ 7,034 $ 1,343 (29.4)% N/A
Operating Margin 8.5% 12.7% 2.5%
Average Daily Package Volume (in thousands) 18,016 16,938 16,295 6.4 % 3.9 %
Average Revenue Per Piece $ 10.58 $ 10.76 $ 10.82 (1.7)% (0.6)%
Net Income (in millions) $ 3,032 $ 4,372 $ 807 (30.6)% N/A
Basic Earnings Per Share $ 3.31 $ 4.65 $ 0.84 (28.8)% N/A
Diluted Earnings Per Share $ 3.28 $ 4.61 $ 0.83 (28.9)% N/A