UPS 2014 Annual Report Download - page 53
Download and view the complete annual report
Please find page 53 of the 2014 UPS annual report below. You can navigate through the pages in the report by either clicking on the pages listed below, or by using the keyword search tool below to find specific information within the annual report.-
 1
1 -
2
-
3
-
4
-
5
-
6
-
7
-
8
-
9
-
10
-
11
-
12
-
13
-
14
-
15
-
16
-
17
-
18
-
19
-
20
-
21
-
22
-
23
-
24
-
25
-
26
-
27
-
28
-
29
-
30
-
31
-
32
-
33
-
34
-
35
-
36
-
37
-
38
-
39
-
40
-
41
-
42
-
 43
43 -
 44
44 -
 45
45 -
 46
46 -
 47
47 -
 48
48 -
 49
49 -
 50
50 -
 51
51 -
 52
52 -
 53
53 -
 54
54 -
 55
55 -
 56
56 -
 57
57 -
 58
58 -
 59
59 -
 60
60 -
 61
61 -
 62
62 -
 63
63 -
64
-
65
-
66
-
67
-
68
-
69
-
70
-
71
-
72
-
73
-
74
-
75
-
76
-
77
-
78
-
79
-
80
-
81
-
82
-
83
-
84
-
85
-
86
-
87
-
88
-
89
-
90
-
91
-
92
-
93
-
94
-
95
-
96
-
97
-
98
-
99
-
100
-
101
-
102
-
103
-
104
-
105
-
106
-
107
-
108
-
109
-
110
-
111
-
112
-
113
-
114
-
115
-
116
-
117
-
118
-
119
-
120
-
121
-
122
-
123
-
124
-
125
-
126
-
127
-
128
-
129
-
130
-
131
-
132
-
133
-
134
-
135
-
136
-
137
-
138
-
139
-
140
 |
 |

UNITED PARCEL SERVICE, INC. AND SUBSIDIARIES
MANAGEMENT'S DISCUSSION AND ANALYSIS OF FINANCIAL CONDITION AND
RESULTS OF OPERATIONS
41
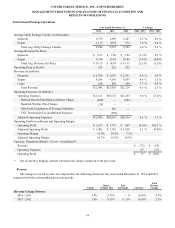
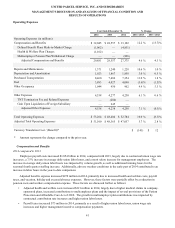
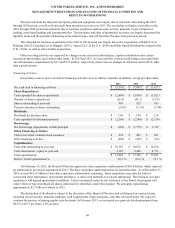
Operating Expenses
Year Ended December 31, % Change
2014 2013 2012 2014 / 2013 2013 / 2012
Operating Expenses (in millions):
Compensation and Benefits $ 32,045 $ 28,557 $ 33,102 12.2 % (13.7)%
Defined Benefit Plans Mark-to-Market Charge (1,062)—
(4,831)
Health & Welfare Plan Charges (1,102)— —
Multiemployer Pension Plan Withdrawal Charge ——
(896)
Adjusted Compensation and Benefits 29,881 28,557 27,375 4.6 % 4.3 %
Repairs and Maintenance 1,371 1,240 1,228 10.6 % 1.0 %
Depreciation and Amortization 1,923 1,867 1,858 3.0 % 0.5 %
Purchased Transportation 8,460 7,486 7,354 13.0 % 1.8 %
Fuel 3,883 4,027 4,090 (3.6)% (1.5)%
Other Occupancy 1,044 950 902 9.9 % 5.3 %
Other Expenses 4,538 4,277 4,250 6.1 % 0.6 %
TNT Termination Fee and Related Expenses —(284)—
Gain Upon Liquidation of Foreign Subsidiary — 245 —
Adjusted Other Expenses 4,538 4,238 4,250 7.1 % (0.3)%
Total Operating Expenses $ 53,264 $ 48,404 $ 52,784 10.0 % (8.3)%
Adjusted Total Operating Expenses $ 51,100 $ 48,365 $ 47,057 5.7 % 2.8 %
Currency Translation Cost / (Benefit)* $ (141) $ 12
* Amount represents the change compared to the prior year.
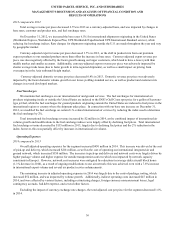
Compensation and Benefits
2014 compared to 2013
Employee payroll costs increased $1.054 billion in 2014, compared with 2013, largely due to contractual union wage rate
increases, a 7.5% increase in average daily union labor hours, and a merit salary increase for management employees. The
increase in average daily union labor hours was impacted by volume growth, as well as additional training hours for the
seasonal fourth quarter staffing increase. Additionally, adverse weather conditions in the early part of 2014 contributed to an
increase in labor hours in the year-to-date comparison.
Adjusted benefits expense increased $270 million in 2014, primarily due to increased health and welfare costs, payroll
taxes, and vacation, holiday and excused absence expenses. However, these factors were partially offset by a reduction in
pension costs and workers compensation expense. These factors are discussed further as follows:
• Adjusted health and welfare costs increased $221 million in 2014, largely due to higher medical claims in company-
sponsored plans, increased contributions to multiemployer plans and the impact of several provisions of the Patient
Protection and Affordable Care Act of 2010. The growth in multiemployer plan contributions was impacted by
contractual contribution rate increases and higher union labor hours.
• Payroll taxes increased $73 million in 2014, primarily as a result of higher union labor hours, union wage rate
increases and higher management incentive compensation payments.