UPS 2013 Annual Report Download - page 93
Download and view the complete annual report
Please find page 93 of the 2013 UPS annual report below. You can navigate through the pages in the report by either clicking on the pages listed below, or by using the keyword search tool below to find specific information within the annual report.-
 1
1 -
2
-
3
-
4
-
5
-
6
-
7
-
8
-
9
-
10
-
11
-
12
-
13
-
14
-
15
-
16
-
17
-
18
-
19
-
20
-
21
-
22
-
23
-
24
-
25
-
26
-
27
-
28
-
29
-
30
-
31
-
32
-
33
-
34
-
35
-
36
-
37
-
38
-
39
-
40
-
41
-
42
-
43
-
44
-
45
-
46
-
47
-
48
-
49
-
50
-
51
-
52
-
53
-
54
-
55
-
56
-
57
-
58
-
59
-
60
-
61
-
62
-
63
-
64
-
65
-
66
-
67
-
68
-
69
-
70
-
71
-
72
-
73
-
74
-
75
-
76
-
77
-
78
-
79
-
80
-
81
-
82
-
 83
83 -
 84
84 -
 85
85 -
 86
86 -
 87
87 -
 88
88 -
 89
89 -
 90
90 -
 91
91 -
 92
92 -
 93
93 -
 94
94 -
 95
95 -
 96
96 -
 97
97 -
 98
98 -
 99
99 -
 100
100 -
 101
101 -
 102
102 -
 103
103 -
104
-
105
-
106
-
107
-
108
-
109
-
110
-
111
-
112
-
113
-
114
-
115
-
116
-
117
-
118
-
119
-
120
-
121
-
122
-
123
-
124
-
125
-
126
-
127
-
128
-
129
-
130
-
131
-
132
-
133
-
134
-
135
-
136
 |
 |

UNITED PARCEL SERVICE, INC. AND SUBSIDIARIES
NOTES TO CONSOLIDATED FINANCIAL STATEMENTS
81
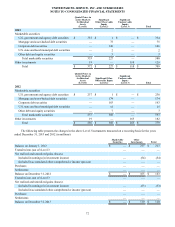
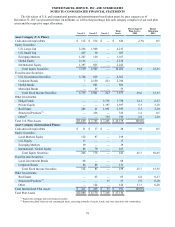
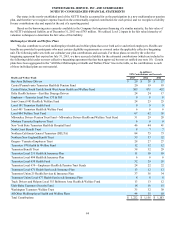
The following table presents the changes in the Level 3 instruments measured on a recurring basis for the years ended
December 31, 2013 and 2012 (in millions). The information presented for 2012 has been revised to include international plan
assets in conformity with the 2013 presentation of international plan assets.
Corporate
Bonds Hedge
Funds Real
Estate Private
Equity Other Total
Balance on January 1, 2012 $ 80 $ 2,132 $ 948 $ 1,354 $ 644 $ 5,158
Actual Return on Assets:
Assets Held at End of Year 1 59 85 163 159 467
Assets Sold During the Year (3) 5 4 — — 6
Purchases 71 1,300 144 184 608 2,307
Sales (11) (667)(142)(285) — (1,105)
Settlements — — — — — —
Transfers Into (Out of) Level 3 — — — — — —
Balance on December 31, 2012 $ 138 $ 2,829 $ 1,039 $ 1,416 $ 1,411 $ 6,833
Actual Return on Assets:
Assets Held at End of Year (1) 229 81 71 (93) 287
Assets Sold During the Year — 5 54 153 54 266
Purchases 165 1,676 145 143 1 2,130
Sales (79) (1,001)(228)(386)(562)(2,256)
Settlements — — — — — —
Transfers Into (Out of) Level 3 — — — — — —
Balance on December 31, 2013 $ 223 $ 3,738 $ 1,091 $ 1,397 $ 811 $ 7,260
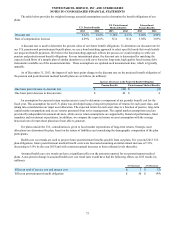
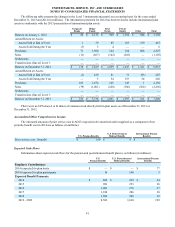
There were no UPS class A or B shares of common stock directly held in plan assets as of December 31, 2013 or
December 31, 2012.
Accumulated Other Comprehensive Income
The estimated amounts of prior service cost in AOCI expected to be amortized and recognized as a component of net
periodic benefit cost in 2014 are as follows (in millions):
U.S. Pension Benefits U.S. Postretirement
Medical Benefits International Pension
Benefits
Prior service cost / (benefit) $ 169 $ 4 $ 1
Expected Cash Flows
Information about expected cash flows for the pension and postretirement benefit plans is as follows (in millions):
U.S.
Pension Benefits U.S. Postretirement
Medical Benefits International Pension
Benefits
Employer Contributions:
2014 (expected) to plan trusts $ — $ — $ 77
2014 (expected) to plan participants 16 100 3
Expected Benefit Payments:
2014 $ 885 $ 239 $ 24
2015 981 253 26
2016 1,081 270 27
2017 1,188 286 30
2018 1,306 300 32
2019 - 2023 8,502 1,610 199