UPS 2013 Annual Report Download - page 6
Download and view the complete annual report
Please find page 6 of the 2013 UPS annual report below. You can navigate through the pages in the report by either clicking on the pages listed below, or by using the keyword search tool below to find specific information within the annual report.-
 1
1 -
 2
2 -
 3
3 -
 4
4 -
 5
5 -
 6
6 -
 7
7 -
 8
8 -
 9
9 -
 10
10 -
 11
11 -
 12
12 -
 13
13 -
 14
14 -
 15
15 -
 16
16 -
 17
17 -
18
-
19
-
20
-
21
-
22
-
23
-
24
-
25
-
26
-
27
-
28
-
29
-
30
-
31
-
32
-
33
-
34
-
35
-
36
-
37
-
38
-
39
-
40
-
41
-
42
-
43
-
44
-
45
-
46
-
47
-
48
-
49
-
50
-
51
-
52
-
53
-
54
-
55
-
56
-
57
-
58
-
59
-
60
-
61
-
62
-
63
-
64
-
65
-
66
-
67
-
68
-
69
-
70
-
71
-
72
-
73
-
74
-
75
-
76
-
77
-
78
-
79
-
80
-
81
-
82
-
83
-
84
-
85
-
86
-
87
-
88
-
89
-
90
-
91
-
92
-
93
-
94
-
95
-
96
-
97
-
98
-
99
-
100
-
101
-
102
-
103
-
104
-
105
-
106
-
107
-
108
-
109
-
110
-
111
-
112
-
113
-
114
-
115
-
116
-
117
-
118
-
119
-
120
-
121
-
122
-
123
-
124
-
125
-
126
-
127
-
128
-
129
-
130
-
131
-
132
-
133
-
134
-
135
-
136
 |
 |
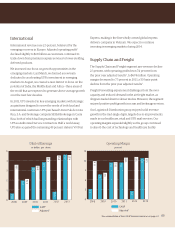
That not only reduces the time and distance in transit, but
also helps merchants capture sales that might be otherwise
lost if their distribution centers are out of stock.
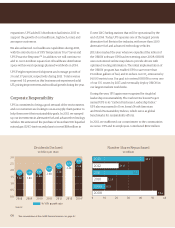
Operating pro t rose 1.6 percent over 2012 adjusted results3
and operating margin dipped slightly from the prior year
adjusted results3, to 13.5 percent. The decline was the result of
high demand for lower-cost residential delivery
products and the higher operating expenses incurred to
honor our service commitments during the holiday season.
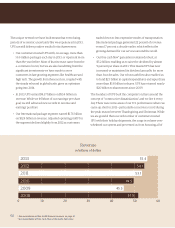
As challenging as the fourth quarter was, the e-commerce
revolution shows no signs of slowing. U.S. online retail sales
could top $500 billion by 2020—nearly doubling the
$260 billion in estimated sales in 2013. In addition to our
omni-channel solutions, UPS continues to expand our
popular UPS My Choice service, which gives nearly
7 million subscribers more exibility over when and where
they receive their shipments.
Every January, we conduct a thorough review of our perfor-
mance during the high-volume holiday season, but this year
we conducted an even more exhaustive assessment. We have
already identi ed several areas of improvement that will
strengthen our network in 2014 and beyond. These include:
• Bolstering our network capacity through facility
expansions, process automation, job simpli cation
and faster implementation of technology
• Ramping up our hub modernization e orts
• Developing more predictive volume planning models
that incorporate changing consumer behavior and sales
promotions
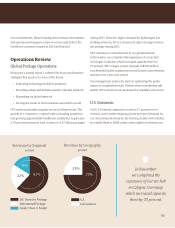
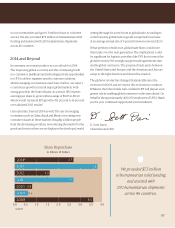
• Expediting the rollout of our proprietary On Road,
Integrated, Optimization and Navigation software
(ORION) with the goal of embedding the technology
into 45 percent of our U.S. driver routes by the end of
2014—almost double the original plan
• Improving our collaboration with large customers so we
have better visibility of every incoming package even
before our customers’ trucks arrive at our facilities
04
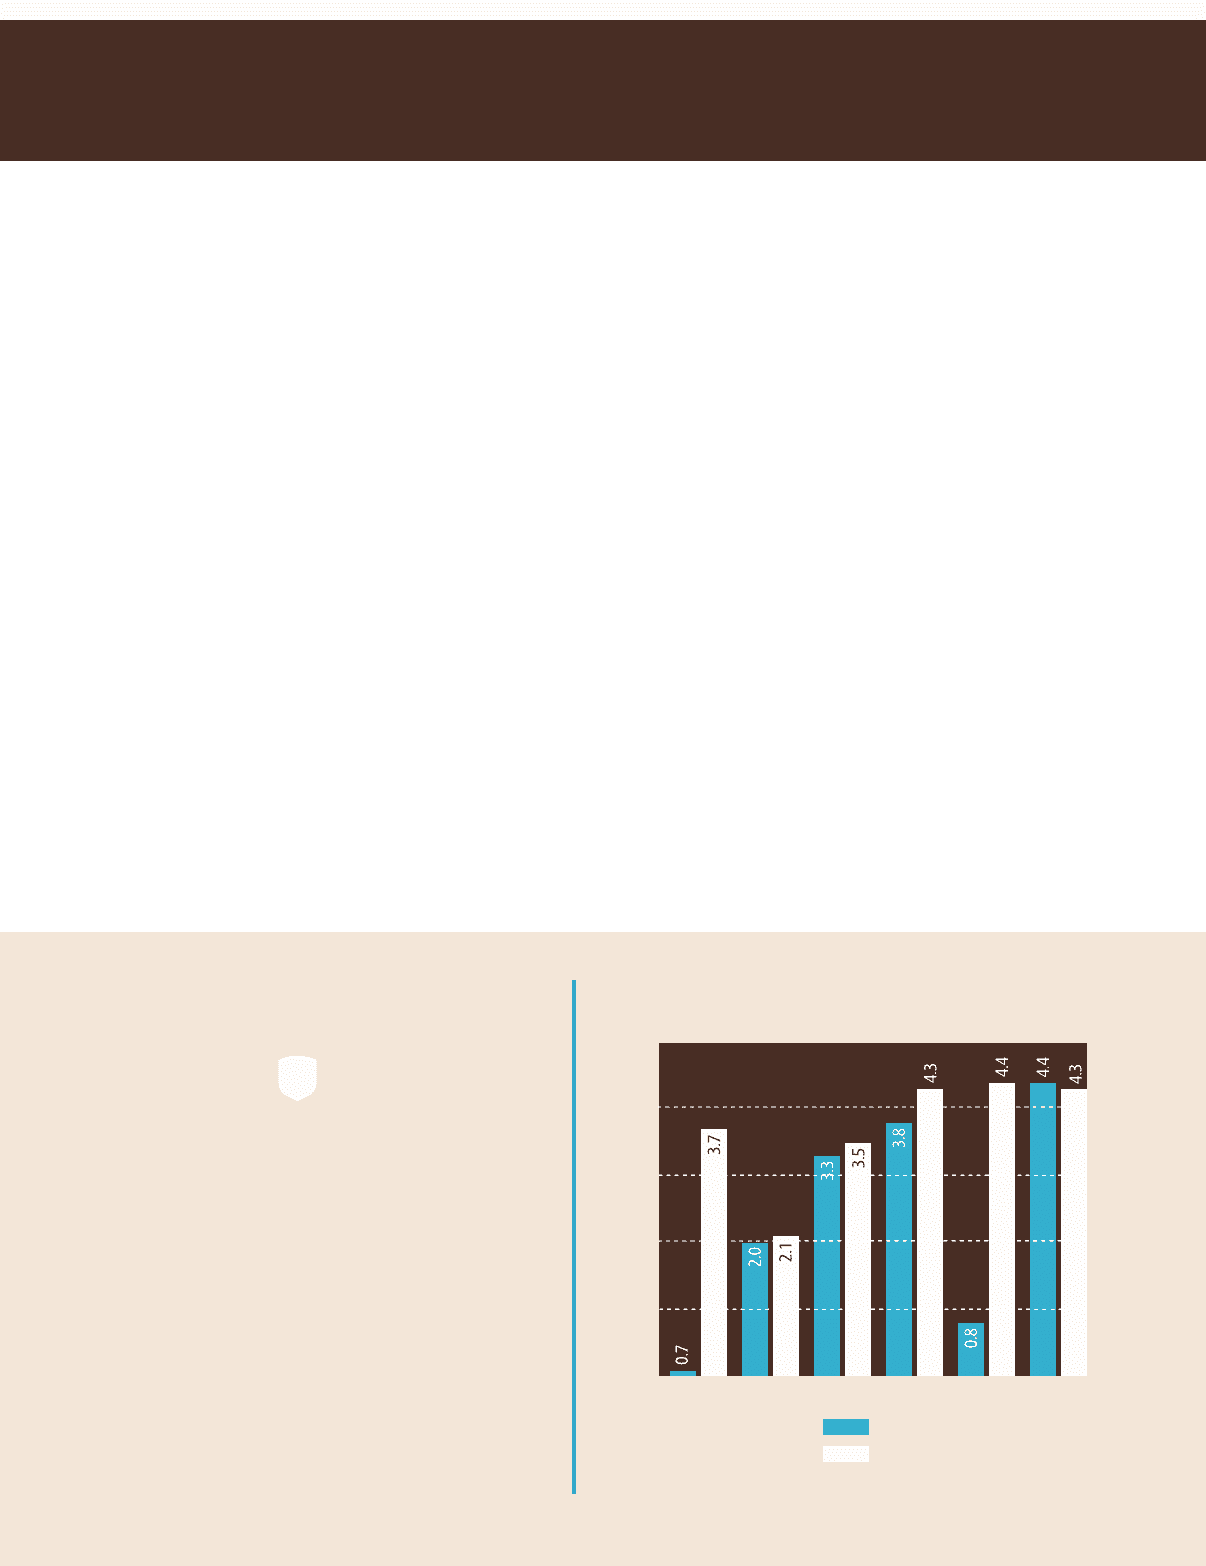
Net Income
in billions of dollars
GAAP
Adjusted3
0
1
2
3
4
5
2008 2009 2010 2011 2012 2013
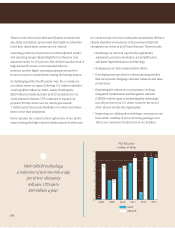
With ORION technolo ,
a reduction of just one mile a day
per driver ultimately
will save UPS up to
$50 million a year.