UPS 2013 Annual Report Download - page 39
Download and view the complete annual report
Please find page 39 of the 2013 UPS annual report below. You can navigate through the pages in the report by either clicking on the pages listed below, or by using the keyword search tool below to find specific information within the annual report.-
 1
1 -
2
-
3
-
4
-
5
-
6
-
7
-
8
-
9
-
10
-
11
-
12
-
13
-
14
-
15
-
16
-
17
-
18
-
19
-
20
-
21
-
22
-
23
-
24
-
25
-
26
-
27
-
28
-
 29
29 -
 30
30 -
 31
31 -
 32
32 -
 33
33 -
 34
34 -
 35
35 -
 36
36 -
 37
37 -
 38
38 -
 39
39 -
 40
40 -
 41
41 -
 42
42 -
 43
43 -
 44
44 -
 45
45 -
 46
46 -
 47
47 -
 48
48 -
 49
49 -
50
-
51
-
52
-
53
-
54
-
55
-
56
-
57
-
58
-
59
-
60
-
61
-
62
-
63
-
64
-
65
-
66
-
67
-
68
-
69
-
70
-
71
-
72
-
73
-
74
-
75
-
76
-
77
-
78
-
79
-
80
-
81
-
82
-
83
-
84
-
85
-
86
-
87
-
88
-
89
-
90
-
91
-
92
-
93
-
94
-
95
-
96
-
97
-
98
-
99
-
100
-
101
-
102
-
103
-
104
-
105
-
106
-
107
-
108
-
109
-
110
-
111
-
112
-
113
-
114
-
115
-
116
-
117
-
118
-
119
-
120
-
121
-
122
-
123
-
124
-
125
-
126
-
127
-
128
-
129
-
130
-
131
-
132
-
133
-
134
-
135
-
136
 |
 |
UNITED PARCEL SERVICE, INC. AND SUBSIDIARIES
MANAGEMENT'S DISCUSSION AND ANALYSIS OF FINANCIAL CONDITION AND
RESULTS OF OPERATIONS
27
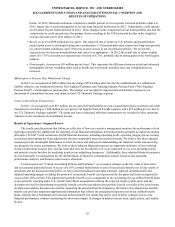
Certain operating expenses are allocated between our reporting segments based on activity-based costing methods. These
activity-based costing methods require us to make estimates that impact the amount of each expense category that is attributed
to each segment. Changes in these estimates will directly impact the amount of expense allocated to each segment, and
therefore the operating profit of each reporting segment. There were no significant changes in our expense allocation
methodology during 2013, 2012 or 2011.
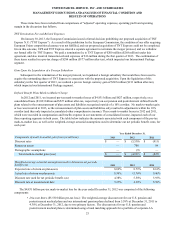
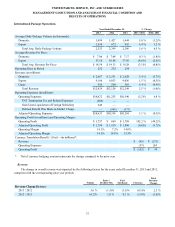
U.S. Domestic Package Operations
Year Ended December 31, % Change
2013 2012 2011 2013 / 2012 2012 / 2011
Average Daily Package Volume (in thousands):
Next Day Air 1,271 1,277 1,206 (0.5)% 5.9 %
Deferred 1,074 1,031 975 4.2 % 5.7 %
Ground 12,060 11,588 11,230 4.1 % 3.2 %
Total Avg. Daily Package Volume 14,405 13,896 13,411 3.7 % 3.6 %
Average Revenue Per Piece:
Next Day Air $ 20.12 $ 19.93 $ 20.33 1.0 % (2.0)%
Deferred 12.70 13.06 13.32 (2.8)% (2.0)%
Ground 7.96 7.89 7.78 0.9 % 1.4 %
Total Avg. Revenue Per Piece $ 9.39 $ 9.38 $ 9.31 0.1 % 0.8 %
Operating Days in Period 252 252 254
Revenue (in millions):
Next Day Air $ 6,443 $ 6,412 $ 6,229 0.5 % 2.9 %
Deferred 3,437 3,392 3,299 1.3 % 2.8 %
Ground 24,194 23,052 22,189 5.0 % 3.9 %
Total Revenue $ 34,074 $32,856 $31,717 3.7 % 3.6 %
Operating Expenses (in millions):
Operating Expenses $ 29,471 $32,397 $27,953 (9.0)% 15.9 %
Defined Benefit Plans Mark-to-Market Charge —(3,177)(479)
Multiemployer Pension Plan Withdrawal Charge —(896) —
Gains (Losses) on Real Estate Transactions — — (15)
Adjusted Operating Expenses $ 29,471 $28,324 $27,459 4.0 % 3.2 %
Operating Profit (in millions) and Operating Margin:
Operating Profit $ 4,603 $ 459 $ 3,764 N/A (87.8)%
Adjusted Operating Profit $ 4,603 $ 4,532 $ 4,258 1.6 % 6.4 %
Operating Margin 13.5% 1.4% 11.9%
Adjusted Operating Margin 13.5% 13.8% 13.4%