UPS 2013 Annual Report Download - page 55
Download and view the complete annual report
Please find page 55 of the 2013 UPS annual report below. You can navigate through the pages in the report by either clicking on the pages listed below, or by using the keyword search tool below to find specific information within the annual report.-
 1
1 -
2
-
3
-
4
-
5
-
6
-
7
-
8
-
9
-
10
-
11
-
12
-
13
-
14
-
15
-
16
-
17
-
18
-
19
-
20
-
21
-
22
-
23
-
24
-
25
-
26
-
27
-
28
-
29
-
30
-
31
-
32
-
33
-
34
-
35
-
36
-
37
-
38
-
39
-
40
-
41
-
42
-
43
-
44
-
 45
45 -
 46
46 -
 47
47 -
 48
48 -
 49
49 -
 50
50 -
 51
51 -
 52
52 -
 53
53 -
 54
54 -
 55
55 -
 56
56 -
 57
57 -
 58
58 -
 59
59 -
 60
60 -
 61
61 -
 62
62 -
 63
63 -
 64
64 -
 65
65 -
66
-
67
-
68
-
69
-
70
-
71
-
72
-
73
-
74
-
75
-
76
-
77
-
78
-
79
-
80
-
81
-
82
-
83
-
84
-
85
-
86
-
87
-
88
-
89
-
90
-
91
-
92
-
93
-
94
-
95
-
96
-
97
-
98
-
99
-
100
-
101
-
102
-
103
-
104
-
105
-
106
-
107
-
108
-
109
-
110
-
111
-
112
-
113
-
114
-
115
-
116
-
117
-
118
-
119
-
120
-
121
-
122
-
123
-
124
-
125
-
126
-
127
-
128
-
129
-
130
-
131
-
132
-
133
-
134
-
135
-
136
 |
 |
UNITED PARCEL SERVICE, INC. AND SUBSIDIARIES
MANAGEMENT'S DISCUSSION AND ANALYSIS OF FINANCIAL CONDITION AND
RESULTS OF OPERATIONS
43
2012 compared to 2011
Interest expense increased in 2012 compared with 2011, largely due to a higher average balance of debt outstanding, as
well as a higher effective interest rate incurred on our debt. The higher effective interest rate largely resulted from two factors:
(1) having a greater proportion of fixed-rate debt outstanding relative to lower-yielding variable rate debt and (2) an increase in
the interest rate indices underlying our variable-rate debt and swaps in 2012. Additionally, interest expense increased in 2012
compared with 2011 due to unfavorable fair value adjustments on interest rate swaps that have not been designated as hedges,
as well as the imputation of interest expense on the multiemployer pension withdrawal liability related to the New England
Pension Fund.
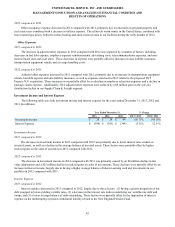
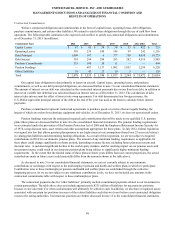
Income Tax Expense
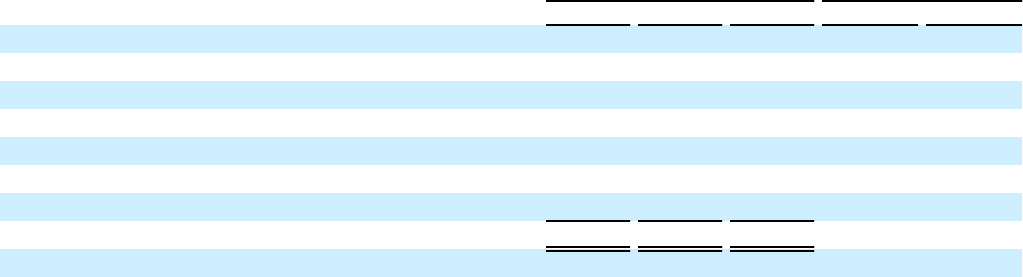
The following table sets forth income tax expense and our effective tax rate for the years ended December 31, 2013, 2012
and 2011 (in millions):
Year Ended December 31, % Change
2013 2012 2011 2013 / 2012 2012 / 2011
Income Tax Expense $ 2,302 $ 167 $ 1,972 N/A (91.5)%
Income Tax Impact of:
TNT Termination Fee and Related Expenses 107 — —
Gain Upon Liquidation of Foreign Subsidiary (32) — —
Defined Benefit Plans Mark-to-Market Charge — 1,808 300
Multiemployer Pension Plan Withdrawal Charge — 337 —
Gain on Real Estate Transactions — — (13)
Adjusted Income Tax Expense $ 2,377 $ 2,312 $ 2,259 2.8% 2.3 %
Effective Tax Rate 34.5% 17.1% 34.1%
Adjusted Effective Tax Rate 35.4% 34.5% 34.4%
2013 compared to 2012
Our adjusted effective tax rate increased to 35.4% in 2013 from 34.5% in 2012, due to a decrease in U.S. Federal and state
tax credits relative to total pre-tax income, and unfavorable changes in the proportion of our taxable income in certain U.S. and
non-U.S. jurisdictions relative to total pre-tax income.
2012 compared to 2011
Our adjusted effective tax rate increased in 2012 compared with 2011 primarily due to the expiration of certain U.S. tax
credit provisions at the end of 2011, and a decrease in the relative benefit of other deductions and tax credits that do not
increase in proportion to increases in pre-tax income. Adjusted income tax expense increased in 2012 compared with 2011
primarily due to higher pre-tax income and the factors described above.