UPS 2013 Annual Report Download - page 75
Download and view the complete annual report
Please find page 75 of the 2013 UPS annual report below. You can navigate through the pages in the report by either clicking on the pages listed below, or by using the keyword search tool below to find specific information within the annual report.-
 1
1 -
2
-
3
-
4
-
5
-
6
-
7
-
8
-
9
-
10
-
11
-
12
-
13
-
14
-
15
-
16
-
17
-
18
-
19
-
20
-
21
-
22
-
23
-
24
-
25
-
26
-
27
-
28
-
29
-
30
-
31
-
32
-
33
-
34
-
35
-
36
-
37
-
38
-
39
-
40
-
41
-
42
-
43
-
44
-
45
-
46
-
47
-
48
-
49
-
50
-
51
-
52
-
53
-
54
-
55
-
56
-
57
-
58
-
59
-
60
-
61
-
62
-
63
-
64
-
 65
65 -
 66
66 -
 67
67 -
 68
68 -
 69
69 -
 70
70 -
 71
71 -
 72
72 -
 73
73 -
 74
74 -
 75
75 -
 76
76 -
 77
77 -
 78
78 -
 79
79 -
 80
80 -
 81
81 -
 82
82 -
 83
83 -
 84
84 -
 85
85 -
86
-
87
-
88
-
89
-
90
-
91
-
92
-
93
-
94
-
95
-
96
-
97
-
98
-
99
-
100
-
101
-
102
-
103
-
104
-
105
-
106
-
107
-
108
-
109
-
110
-
111
-
112
-
113
-
114
-
115
-
116
-
117
-
118
-
119
-
120
-
121
-
122
-
123
-
124
-
125
-
126
-
127
-
128
-
129
-
130
-
131
-
132
-
133
-
134
-
135
-
136
 |
 |

63
UNITED PARCEL SERVICE, INC. AND SUBSIDIARIES
STATEMENTS OF CONSOLIDATED INCOME
(In millions, except per share amounts)
Years Ended December 31,
2013 2012 2011
Revenue $ 55,438 $ 54,127 $ 53,105
Operating Expenses:
Compensation and benefits 28,557 33,102 27,575
Repairs and maintenance 1,240 1,228 1,286
Depreciation and amortization 1,867 1,858 1,782
Purchased transportation 7,486 7,354 7,232
Fuel 4,027 4,090 4,046
Other occupancy 950 902 943
Other expenses 4,277 4,250 4,161
Total Operating Expenses 48,404 52,784 47,025
Operating Profit 7,034 1,343 6,080
Other Income and (Expense):
Investment income 20 24 44
Interest expense (380)(393)(348)
Total Other Income and (Expense) (360)(369)(304)
Income Before Income Taxes 6,674 974 5,776
Income Tax Expense 2,302 167 1,972
Net Income $ 4,372 $ 807 $ 3,804
Basic Earnings Per Share $ 4.65 $ 0.84 $ 3.88
Diluted Earnings Per Share $ 4.61 $ 0.83 $ 3.84
STATEMENTS OF CONSOLIDATED COMPREHENSIVE INCOME
(In millions)
Years Ended December 31,
2013 2012 2011
Net income $ 4,372 $ 807 $ 3,804
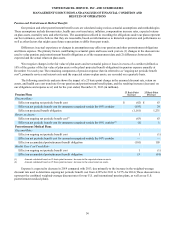
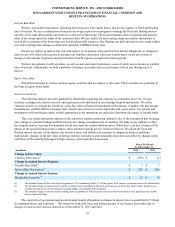
Change in foreign currency translation adjustment, net of tax (260) 294 (92)
Change in unrealized gain (loss) on marketable securities, net of tax (7) — (6)
Change in unrealized gain (loss) on cash flow hedges, net of tax 67 (82) 35
Change in unrecognized pension and postretirement benefit costs, net of tax 3,094 (463)(405)
Comprehensive income $ 7,266 $ 556 $ 3,336
See notes to consolidated financial statements.