UPS 2013 Annual Report Download - page 54
Download and view the complete annual report
Please find page 54 of the 2013 UPS annual report below. You can navigate through the pages in the report by either clicking on the pages listed below, or by using the keyword search tool below to find specific information within the annual report.-
 1
1 -
2
-
3
-
4
-
5
-
6
-
7
-
8
-
9
-
10
-
11
-
12
-
13
-
14
-
15
-
16
-
17
-
18
-
19
-
20
-
21
-
22
-
23
-
24
-
25
-
26
-
27
-
28
-
29
-
30
-
31
-
32
-
33
-
34
-
35
-
36
-
37
-
38
-
39
-
40
-
41
-
42
-
43
-
 44
44 -
 45
45 -
 46
46 -
 47
47 -
 48
48 -
 49
49 -
 50
50 -
 51
51 -
 52
52 -
 53
53 -
 54
54 -
 55
55 -
 56
56 -
 57
57 -
 58
58 -
 59
59 -
 60
60 -
 61
61 -
 62
62 -
 63
63 -
 64
64 -
65
-
66
-
67
-
68
-
69
-
70
-
71
-
72
-
73
-
74
-
75
-
76
-
77
-
78
-
79
-
80
-
81
-
82
-
83
-
84
-
85
-
86
-
87
-
88
-
89
-
90
-
91
-
92
-
93
-
94
-
95
-
96
-
97
-
98
-
99
-
100
-
101
-
102
-
103
-
104
-
105
-
106
-
107
-
108
-
109
-
110
-
111
-
112
-
113
-
114
-
115
-
116
-
117
-
118
-
119
-
120
-
121
-
122
-
123
-
124
-
125
-
126
-
127
-
128
-
129
-
130
-
131
-
132
-
133
-
134
-
135
-
136
 |
 |

UNITED PARCEL SERVICE, INC. AND SUBSIDIARIES
MANAGEMENT'S DISCUSSION AND ANALYSIS OF FINANCIAL CONDITION AND
RESULTS OF OPERATIONS
42
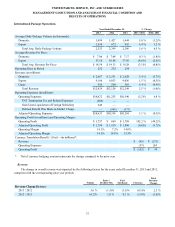
2012 compared to 2011
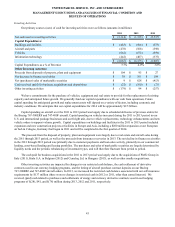
Other occupancy expense decreased in 2012 compared with 2011, primarily due to reductions in personal property and
real estate taxes combined with a decrease in utilities expense. The relatively warm winter in the United States, combined with
lower natural gas prices, helped to reduce heating and snow removal costs in our facilities during the early months of 2012.
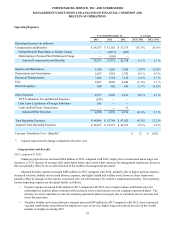
Other Expenses
2013 compared to 2012
The decrease in adjusted other expenses in 2013 compared with 2012 was impacted by a number of factors, including
decreases in bad debt expense, employee expense reimbursements, advertising costs, telecommunications expenses, and non-
income based state and local taxes. These decreases in expense were partially offset by increases in auto liability insurance,
transportation equipment rentals, and air cargo handling costs.
2012 compared to 2011
Adjusted other expenses increased in 2012 compared with 2011, primarily due to an increase in transportation equipment
rentals, bad debt expense and auto liability insurance, as well as expenses incurred in 2012 related to the proposed TNT
Express N.V. acquisition. These increases were partially offset by a reduction in employee relocation expenses and a decline in
package claims expense. Additionally, 2012 adjusted other expenses were reduced by a $9 million gain on the sale of a
distribution facility in our Supply Chain & Freight segment.
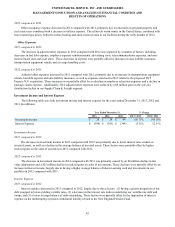
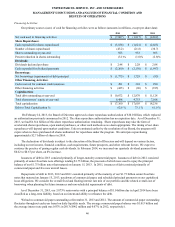
Investment Income and Interest Expense
The following table sets forth investment income and interest expense for the years ended December 31, 2013, 2012 and
2011 (in millions):
Year Ended December 31, % Change
2013 2012 2011 2013 / 2012 2012 / 2011
Investment Income $ 20 $ 24 $ 44 (16.7)% (45.5)%
Interest Expense $ (380) $ (393) $ (348) (3.3)% 12.9 %
Investment Income
2013 compared to 2012
The decrease in investment income in 2013 compared with 2012 was primarily due to lower interest rates earned on
invested assets, as well as a decline in the average balance of invested assets. These factors were partially offset by higher
realized gains on the sales of securities in 2013 compared with 2012.
2012 compared to 2011
The decrease in investment income in 2012 compared with 2011 was primarily caused by an $8 million decline in fair
value adjustments and a $25 million decline in realized gains on sales of investments. These declines were partially offset by an
increase in interest income, largely due to having a higher average balance of interest-earning cash and investments in our
portfolio in 2012 compared with 2011.
Interest Expense
2013 compared to 2012
Interest expense decreased in 2013 compared to 2012, largely due to three factors: (1) having a greater proportion of our
debt swapped to lower-yielding variable rates, (2) a decrease in the interest rate indices underlying our variable-rate debt and
swaps, and (3) a lower average balance of debt outstanding. These factors were partially offset by the imputation of interest
expense on the multiemployer pension withdrawal liability related to the New England Pension Fund.